Publication
Metrics
AI Quick Summary
This paper systematically compares fault trees (FTs), decision trees (DTs), and binary decision diagrams (BDDs) based on their purpose, structure, analysis, construction, and benefits/limitations. It highlights that while each model has distinct applications and structural representations, BDDs offer a more efficient way to represent logical rules due to sub-node sharing.
Paper Preview
Abstract
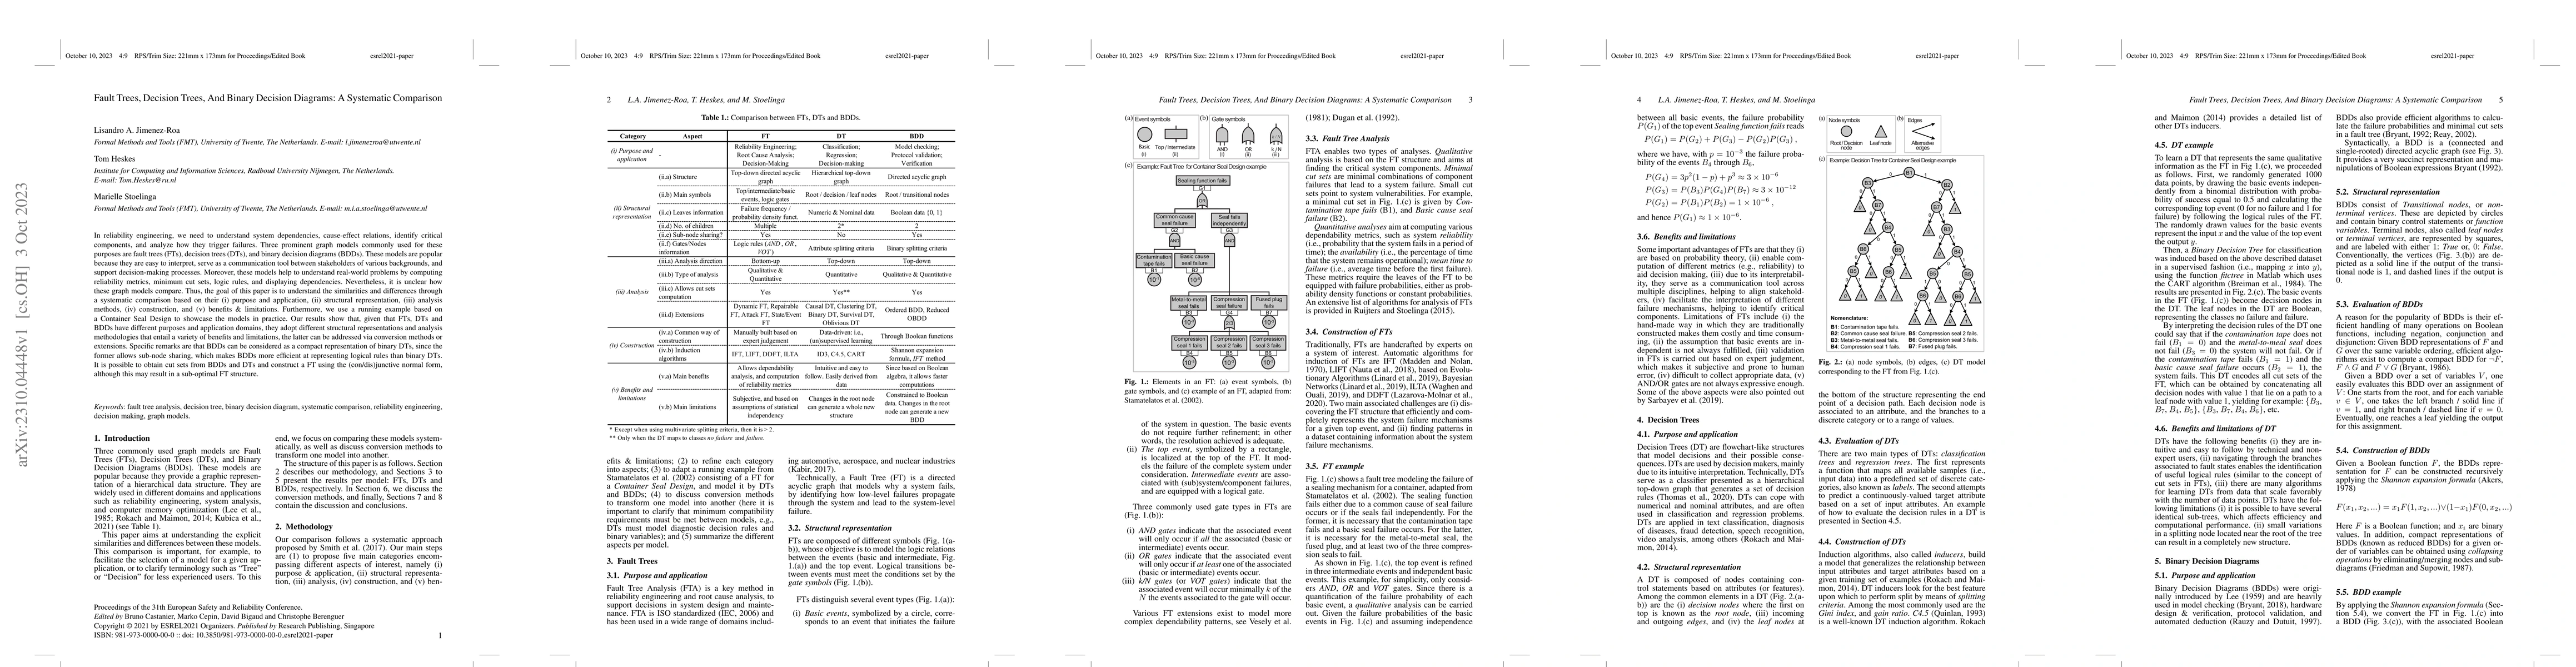
In reliability engineering, we need to understand system dependencies, cause-effect relations, identify critical components, and analyze how they trigger failures. Three prominent graph models commonly used for these purposes are fault trees (FTs), decision trees (DTs), and binary decision diagrams (BDDs). These models are popular because they are easy to interpret, serve as a communication tool between stakeholders of various backgrounds, and support decision-making processes. Moreover, these models help to understand real-world problems by computing reliability metrics, minimum cut sets, logic rules, and displaying dependencies. Nevertheless, it is unclear how these graph models compare. Thus, the goal of this paper is to understand the similarities and differences through a systematic comparison based on their (i) purpose and application, (ii) structural representation, (iii) analysis methods, (iv) construction, and (v) benefits & limitations. Furthermore, we use a running example based on a Container Seal Design to showcase the models in practice. Our results show that, given that FTs, DTs and BDDs have different purposes and application domains, they adopt different structural representations and analysis methodologies that entail a variety of benefits and limitations, the latter can be addressed via conversion methods or extensions. Specific remarks are that BDDs can be considered as a compact representation of binary DTs, since the former allows sub-node sharing, which makes BDDs more efficient at representing logical rules than binary DTs. It is possible to obtain cut sets from BDDs and DTs and construct a FT using the (con/dis)junctive normal form, although this may result in a sub-optimal FT structure.
AI Key Findings
Get AI-generated insights about this paper's methodology, results, significance, and more — seven facets brought into focus.
Impact
Paper Details
Authors
PDF Preview
Key Terms
Citation Network
Current paper (gray), citations (green), references (blue)
Display is limited for performance on very large graphs.
Discussion 0