Filtering Patent Maps for Visualization of Diversification Paths of Inventors and Organizations
Publication
Metrics
AI Quick Summary
This paper proposes a method to filter patent network maps by removing weak links while maintaining the explanatory power for inventor and organization diversification. It introduces an optimal trade-off approach to visualization, demonstrating its effectiveness through case studies on inventor Leonard Forbes and company Google.
Paper Preview
Abstract
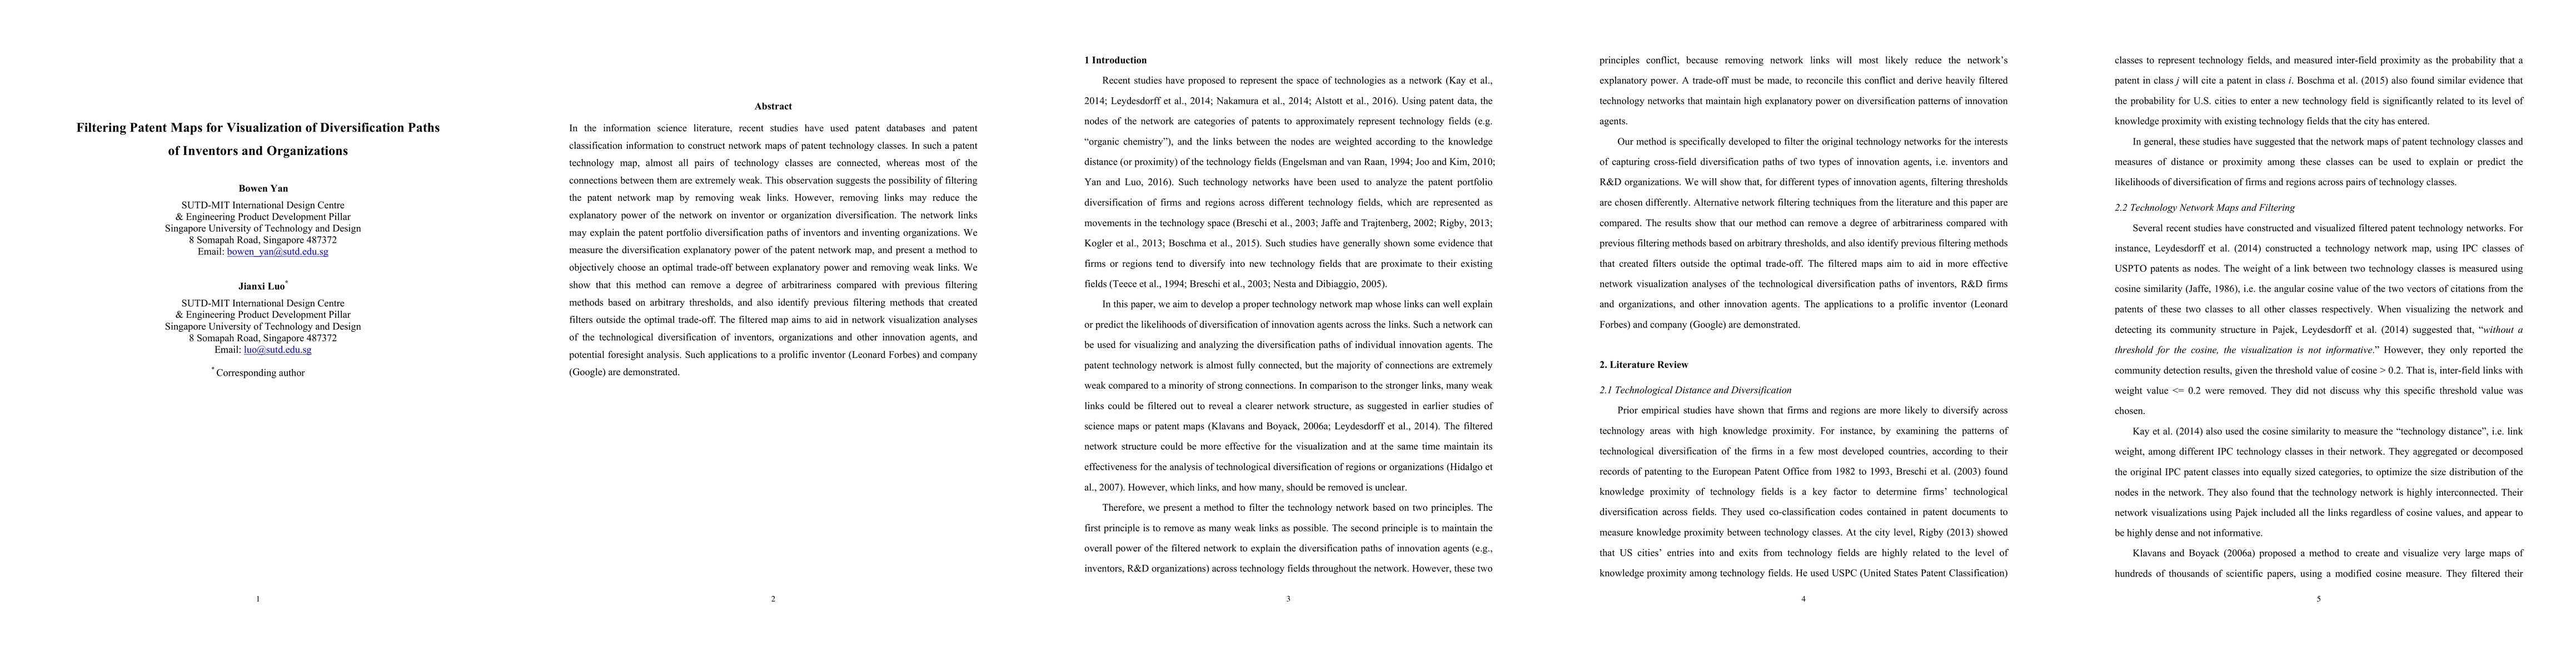
In the information science literature, recent studies have used patent databases and patent classification information to construct network maps of patent technology classes. In such a patent technology map, almost all pairs of technology classes are connected, whereas most of the connections between them are extremely weak. This observation suggests the possibility of filtering the patent network map by removing weak links. However, removing links may reduce the explanatory power of the network on inventor or organization diversification. The network links may explain the patent portfolio diversification paths of inventors and inventing organizations. We measure the diversification explanatory power of the patent network map, and present a method to objectively choose an optimal trade-off between explanatory power and removing weak links. We show that this method can remove a degree of arbitrariness compared with previous filtering methods based on arbitrary thresholds, and also identify previous filtering methods that created filters outside the optimal trade-off. The filtered map aims to aid in network visualization analyses of the technological diversification of inventors, organizations and other innovation agents, and potential foresight analysis. Such applications to a prolific inventor (Leonard Forbes) and company (Google) are demonstrated.
AI Key Findings
Get AI-generated insights about this paper's methodology, results, significance, and more — seven facets brought into focus.
Impact
Paper Details
PDF Preview
Key Terms
Citation Network
Current paper (gray), citations (green), references (blue)
Display is limited for performance on very large graphs.
Discussion 0