Financial Time Series Data Processing for Machine Learning
Publication
Metrics
AI Quick Summary
This paper examines methods for processing financial time series data for machine learning, comparing scaling techniques based on their ability to achieve stationarity while preserving information for trend forecasting, and discusses data splitting and labelling methods to prevent overfitting.
Paper Preview
Abstract
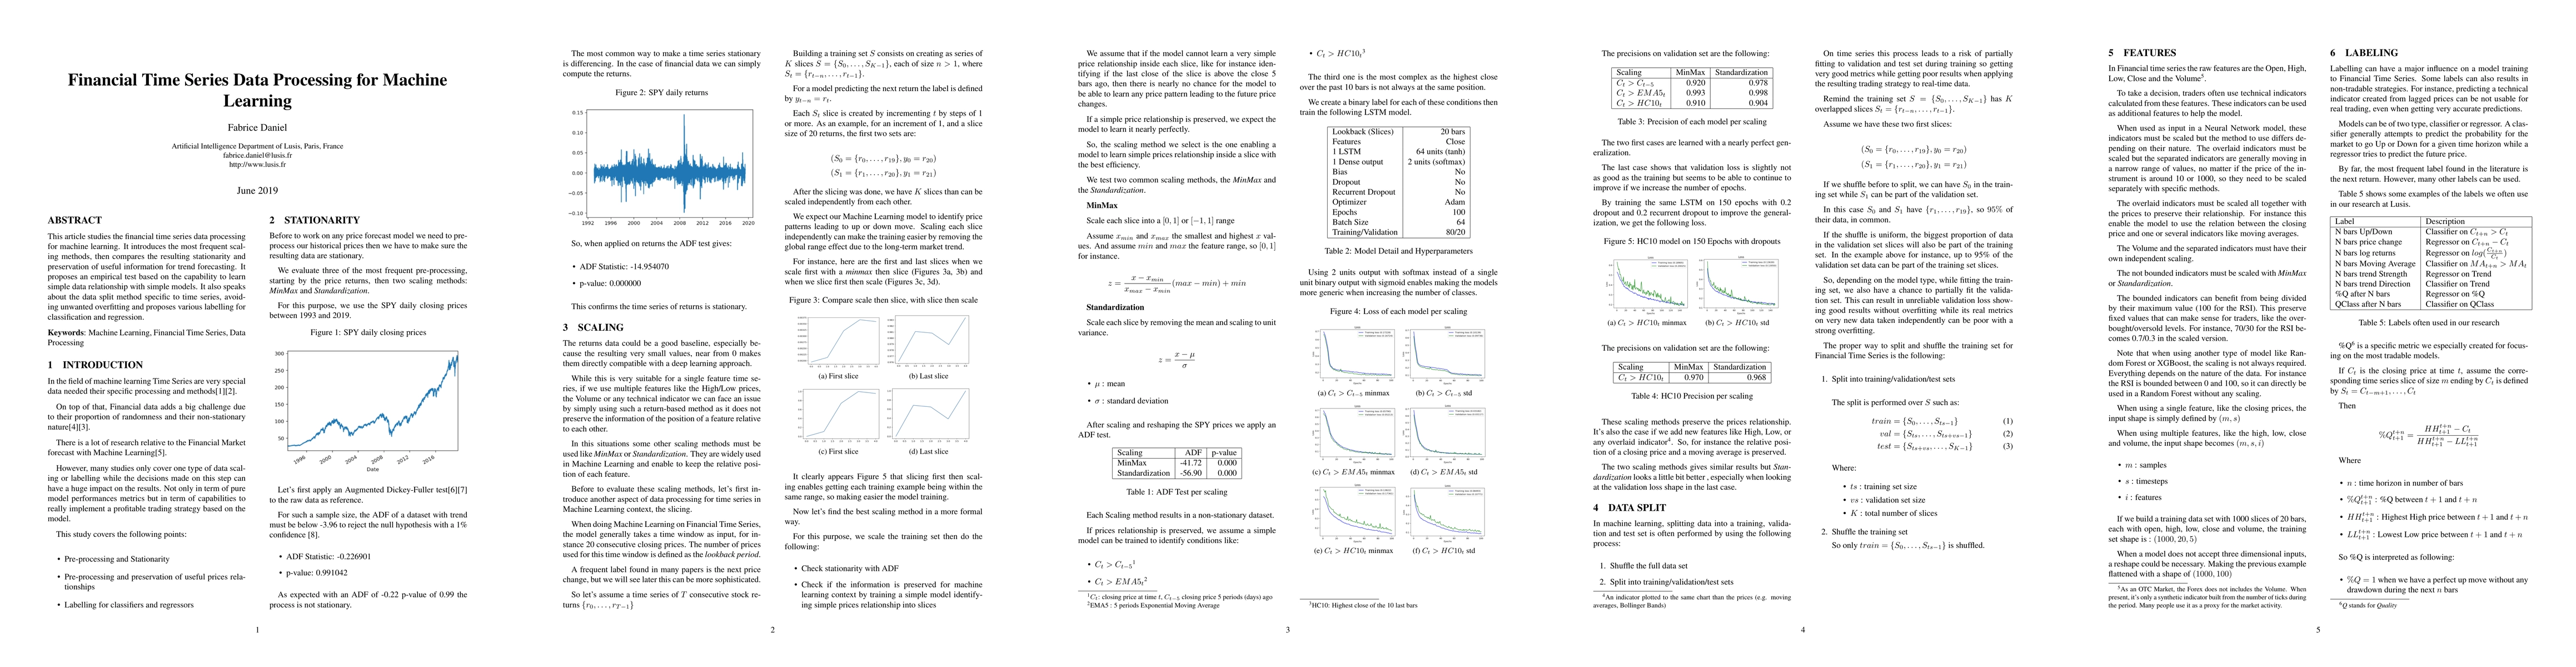
This article studies the financial time series data processing for machine learning. It introduces the most frequent scaling methods, then compares the resulting stationarity and preservation of useful information for trend forecasting. It proposes an empirical test based on the capability to learn simple data relationship with simple models. It also speaks about the data split method specific to time series, avoiding unwanted overfitting and proposes various labelling for classification and regression.
AI Key Findings
Get AI-generated insights about this paper's methodology, results, significance, and more — seven facets brought into focus.
Impact
Paper Details
PDF Preview
Key Terms
Citation Network
Current paper (gray), citations (green), references (blue)
Display is limited for performance on very large graphs.
Discussion 0