Finding critical points and correlation length exponents using finite size scaling of Gini index
Publication
Metrics
AI Quick Summary
This paper explores the use of the Gini index to determine critical points and correlation length exponents in systems undergoing continuous phase transitions. It demonstrates that the variability quantified by the Gini index follows a finite size scaling relation, providing a method to extract critical exponents from numerical simulations.
Paper Preview
Abstract
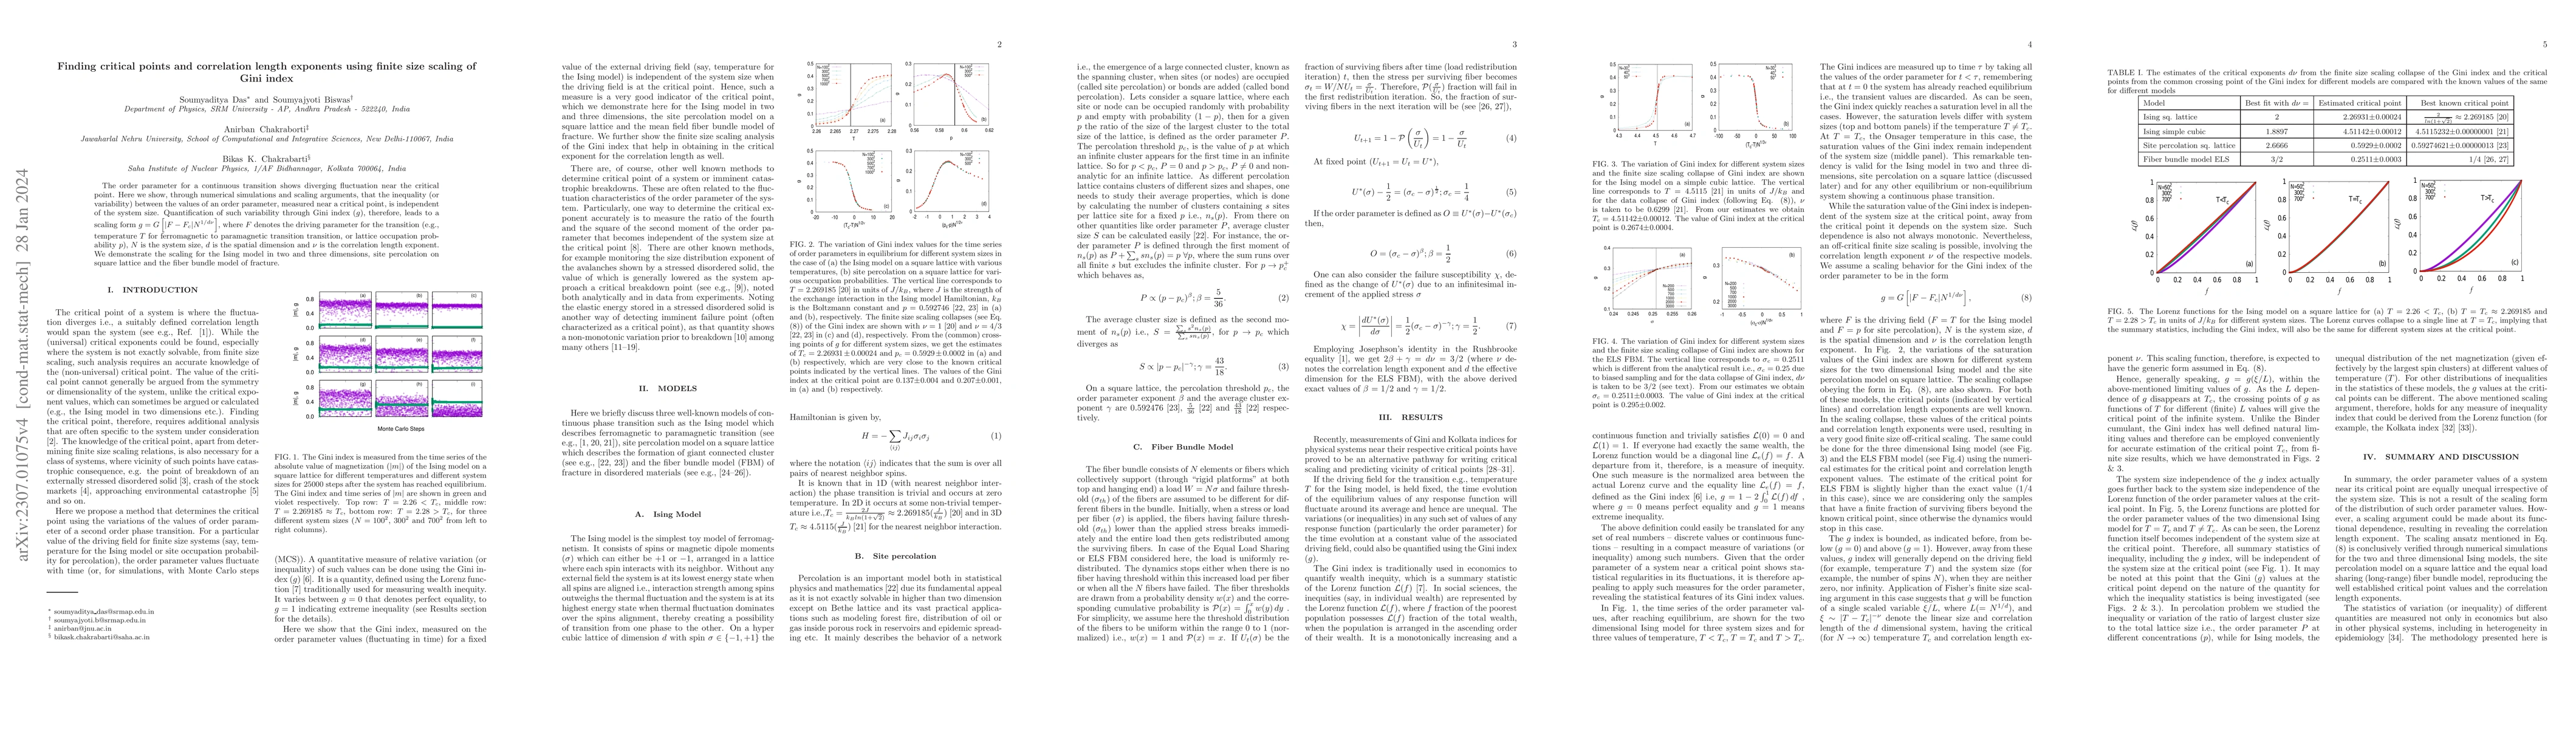
The order parameter for a continuous transition shows diverging fluctuation near the critical point. Here we show, through numerical simulations and scaling arguments, that the inequality (or variability) between the values of an order parameter, measured near a critical point, is independent of the system size. Quantification of such variability through Gini index ($g$), therefore, leads to a scaling form $g=G\left[|F-F_c|N^{1/d\nu}\right]$, where $F$ denotes the driving parameter for the transition (e.g., temperature $T$ for ferromagnetic to paramagnetic transition transition, or lattice occupation probability $p$), $N$ is the system size, $d$ is the spatial dimension and $\nu$ is the correlation length exponent. We demonstrate the scaling for the Ising model in two and three dimensions, site percolation on square lattice and the fiber bundle model of fracture.
AI Key Findings
Get AI-generated insights about this paper's methodology, results, significance, and more — seven facets brought into focus.
Impact
Paper Details
Authors
PDF Preview
Key Terms
Citation Network
Current paper (gray), citations (green), references (blue)
Display is limited for performance on very large graphs.
Discussion 0