Publication
Metrics
AI Quick Summary
This paper proposes a novel method for detecting outliers in surface, image, and video data by analyzing mean and variability of degree of outlyingness at each grid point. The method flags outliers in a functional outlier map, with heatmaps highlighting the most deviating regions, and is demonstrated through applications on fluorescence spectra, MRI data, and video surveillance.
Paper Preview
Abstract
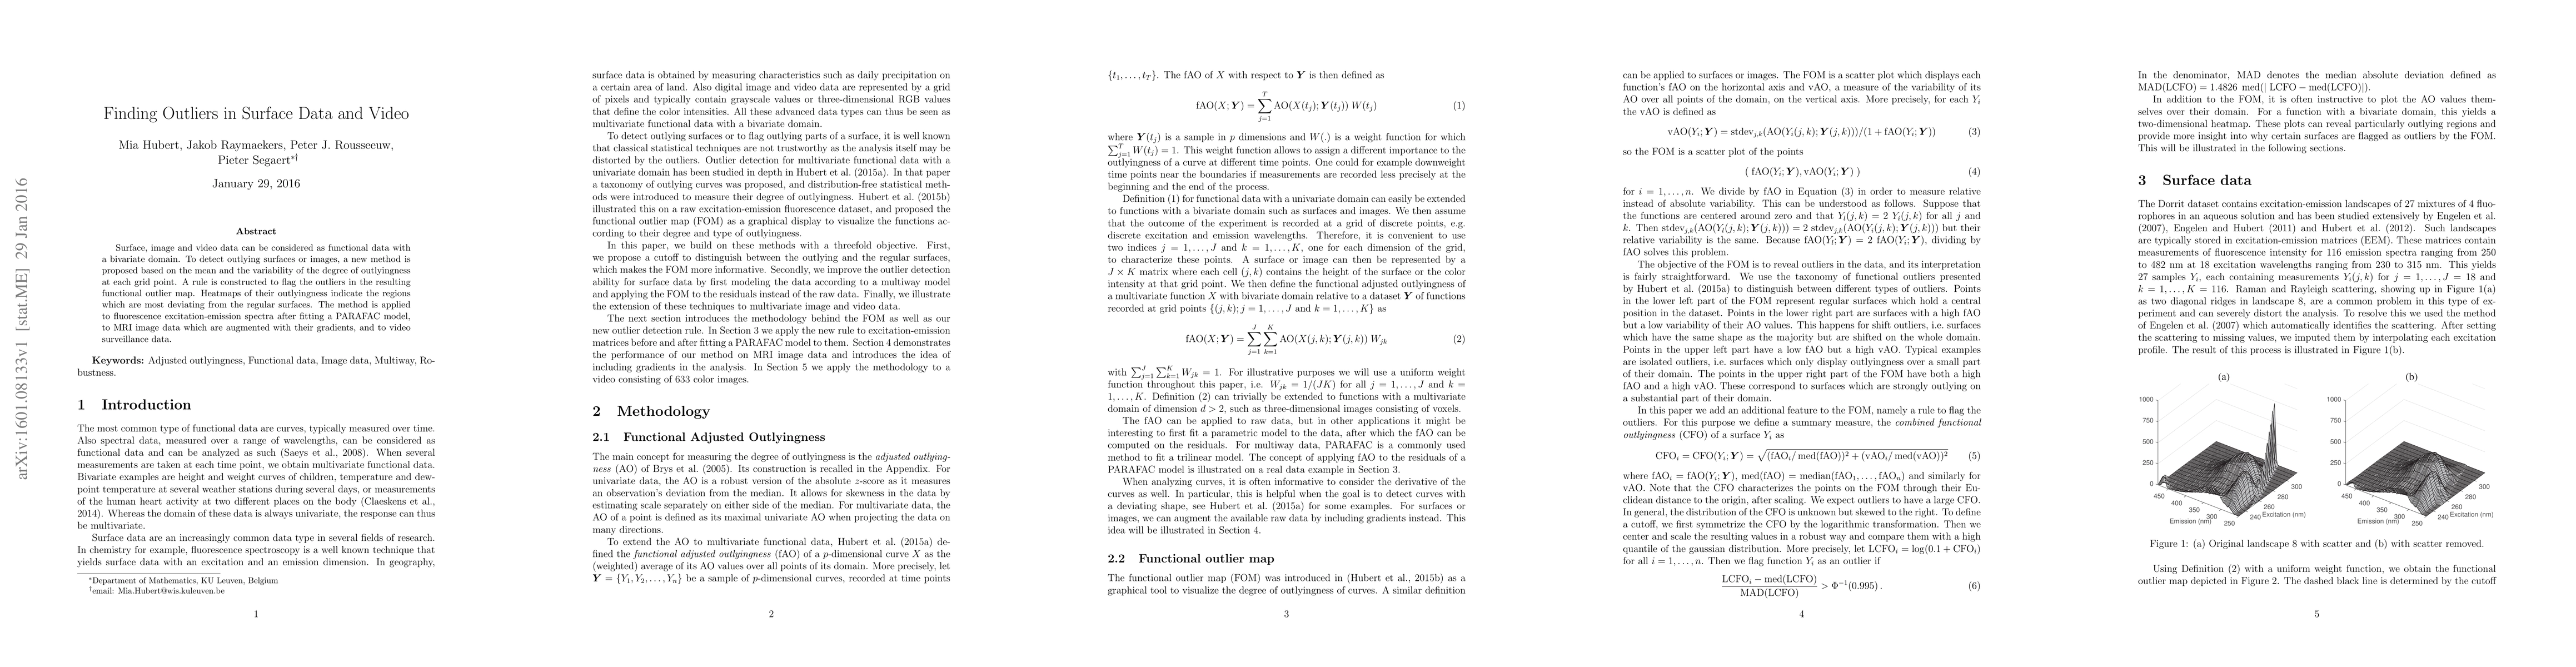
Surface, image and video data can be considered as functional data with a bivariate domain. To detect outlying surfaces or images, a new method is proposed based on the mean and the variability of the degree of outlyingness at each grid point. A rule is constructed to flag the outliers in the resulting functional outlier map. Heatmaps of their outlyingness indicate the regions which are most deviating from the regular surfaces. The method is applied to fluorescence excitation-emission spectra after fitting a PARAFAC model, to MRI image data which are augmented with their gradients, and to video surveillance data.
AI Key Findings
Get AI-generated insights about this paper's methodology, results, significance, and more — seven facets brought into focus.
Impact
Paper Details
PDF Preview
Key Terms
Citation Network
Current paper (gray), citations (green), references (blue)
Display is limited for performance on very large graphs.
Discussion 0