Finding Patterns in Visualized Data by Adding Redundant Visual Information
Publication
Metrics
AI Quick Summary
The method outperforms others using different distance metrics and is particularly effective for specific types of data perturbations.
Paper Preview
Abstract
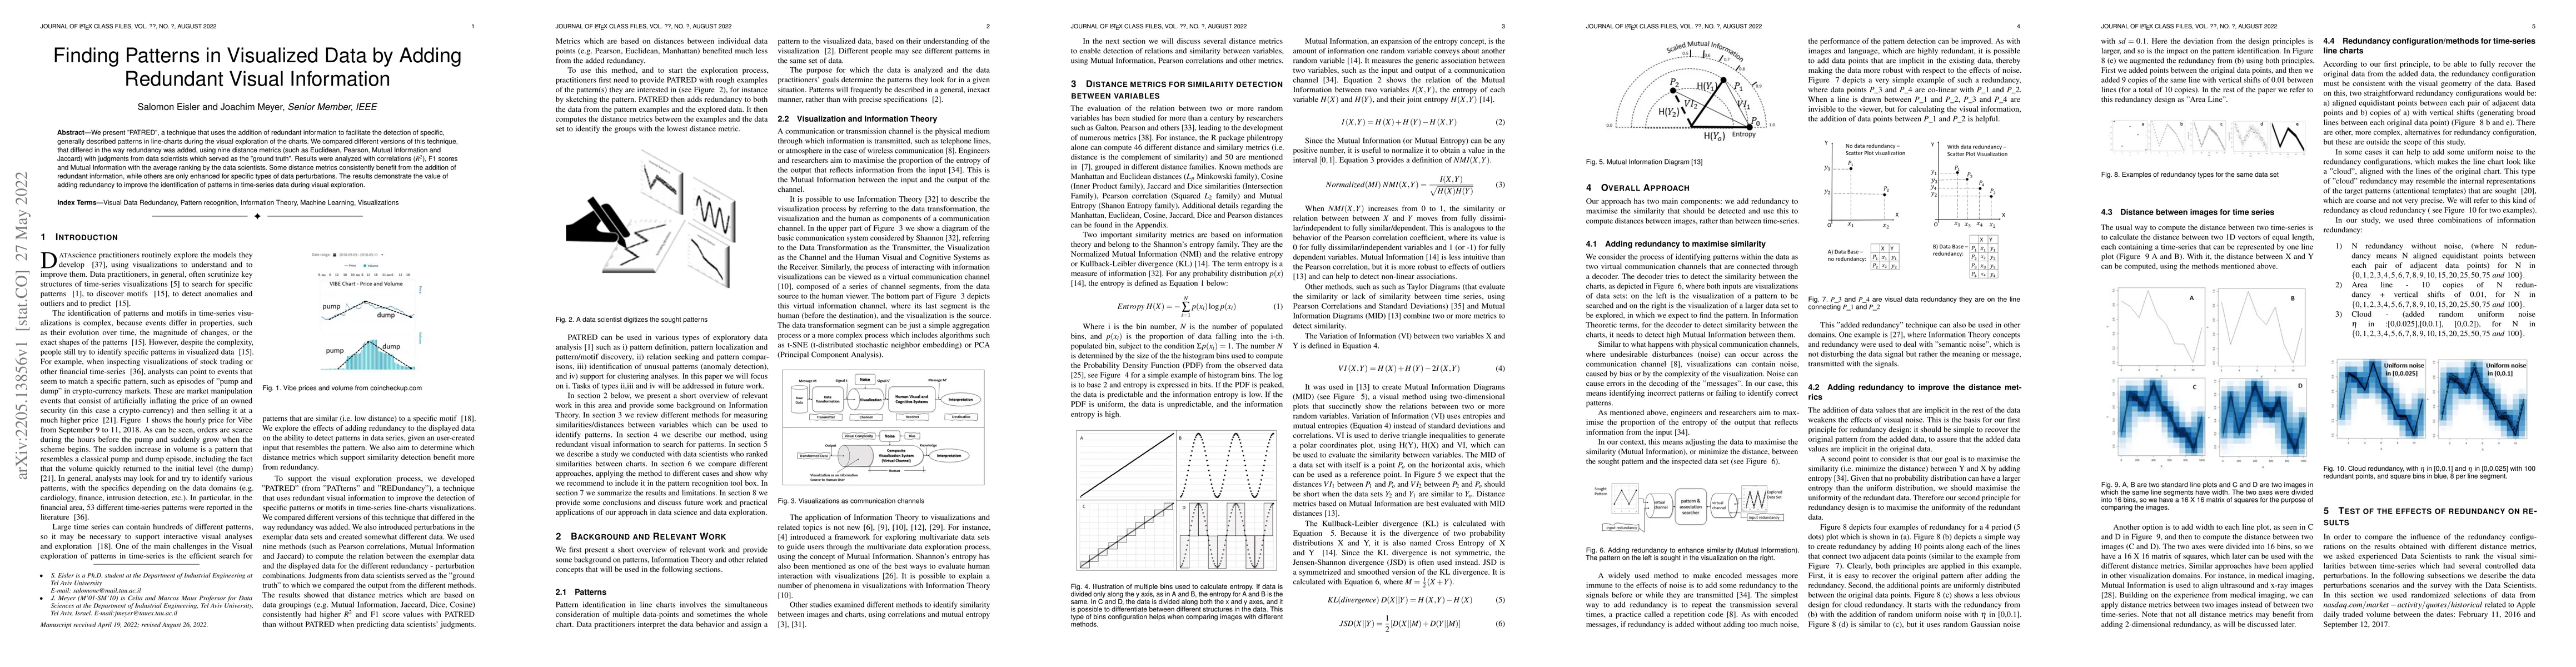
We present "PATRED", a technique that uses the addition of redundant information to facilitate the detection of specific, generally described patterns in line-charts during the visual exploration of the charts. We compared different versions of this technique, that differed in the way redundancy was added, using nine distance metrics (such as Euclidean, Pearson, Mutual Information and Jaccard) with judgments from data scientists which served as the "ground truth". Results were analyzed with correlations (R2), F1 scores and Mutual Information with the average ranking by the data scientists. Some distance metrics consistently benefit from the addition of redundant information, while others are only enhanced for specific types of data perturbations. The results demonstrate the value of adding redundancy to improve the identification of patterns in time-series data during visual exploration.
AI Key Findings
Get AI-generated insights about this paper's methodology, results, significance, and more — seven facets brought into focus.
Impact
Paper Details
Authors
PDF Preview
Key Terms
Citation Network
Current paper (gray), citations (green), references (blue)
Display is limited for performance on very large graphs.
Discussion 0