Summary
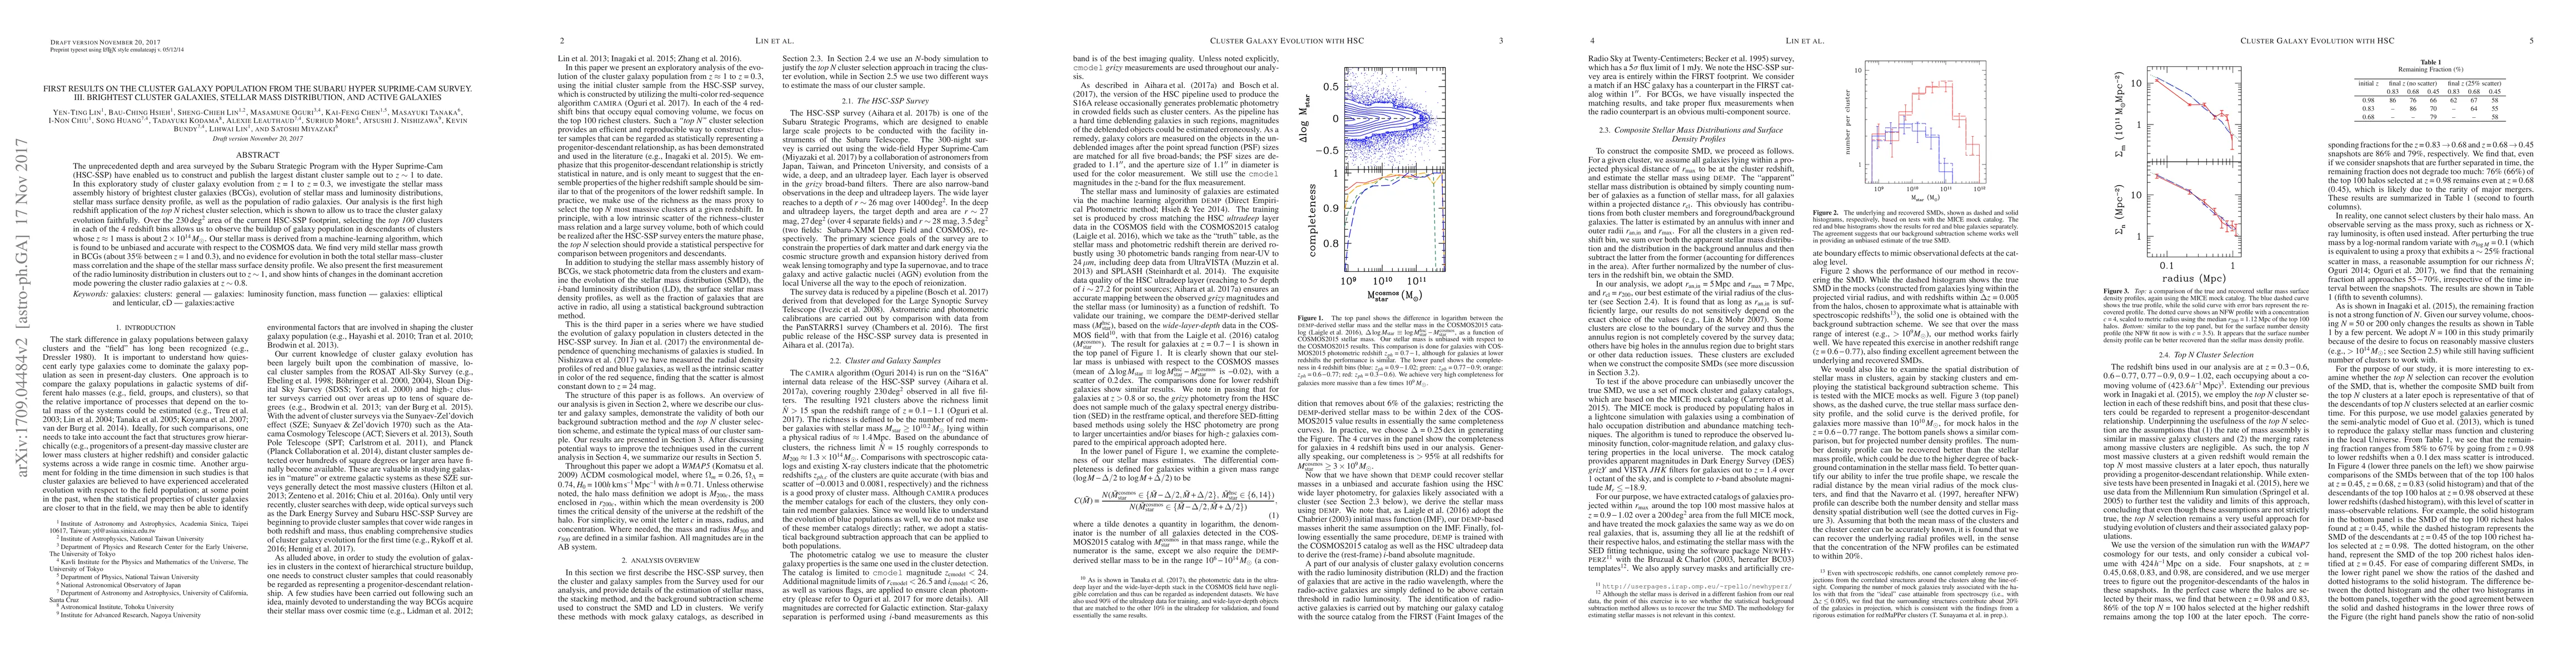
The unprecedented depth and area surveyed by the Subaru Strategic Program with the Hyper Suprime-Cam (HSC-SSP) have enabled us to construct and publish the largest distant cluster sample out to $z\sim 1$ to date. In this exploratory study of cluster galaxy evolution from $z=1$ to $z=0.3$, we investigate the stellar mass assembly history of brightest cluster galaxies (BCGs), evolution of stellar mass and luminosity distributions, stellar mass surface density profile, as well as the population of radio galaxies. Our analysis is the first high redshift application of the top N richest cluster selection, which is shown to allow us to trace the cluster galaxy evolution faithfully. Over the 230 deg$^2$ area of the current HSC-SSP footprint, selecting the top 100 clusters in each of the 4 redshift bins allows us to observe the buildup of galaxy population in descendants of clusters whose $z\approx 1$ mass is about $2\times 10^{14}\,M_\odot$. Our stellar mass is derived from a machine-learning algorithm, which is found to be unbiased and accurate with respect to the COSMOS data. We find very mild stellar mass growth in BCGs (about 35% between $z=1$ and 0.3), and no evidence for evolution in both the total stellar mass-cluster mass correlation and the shape of the stellar mass surface density profile. We also present the first measurement of the radio luminosity distribution in clusters out to $z\sim 1$, and show hints of changes in the dominant accretion mode powering the cluster radio galaxies at $z\sim 0.8$.
AI Key Findings
Get AI-generated insights about this paper's methodology, results, and significance.
Paper Details
PDF Preview
Key Terms
Citation Network
Current paper (gray), citations (green), references (blue)
Display is limited for performance on very large graphs.
Similar Papers
Found 4 papers| Title | Authors | Year | Actions |
|---|
Comments (0)