First Sagittarius A* Event Horizon Telescope Results. II. EHT and Multi-wavelength Observations, Data Processing, and Calibration
Publication
Metrics
AI Quick Summary
This paper details the Event Horizon Telescope's 1.3 mm observations of Sagittarius A* during the 2017 campaign, employing novel calibration methods to account for its variability. The study finds the majority of emission originates from near the horizon, with intrinsic variability detected on short timescales, and a blurred ring structure consistent with later analyses.
Paper Preview
Abstract
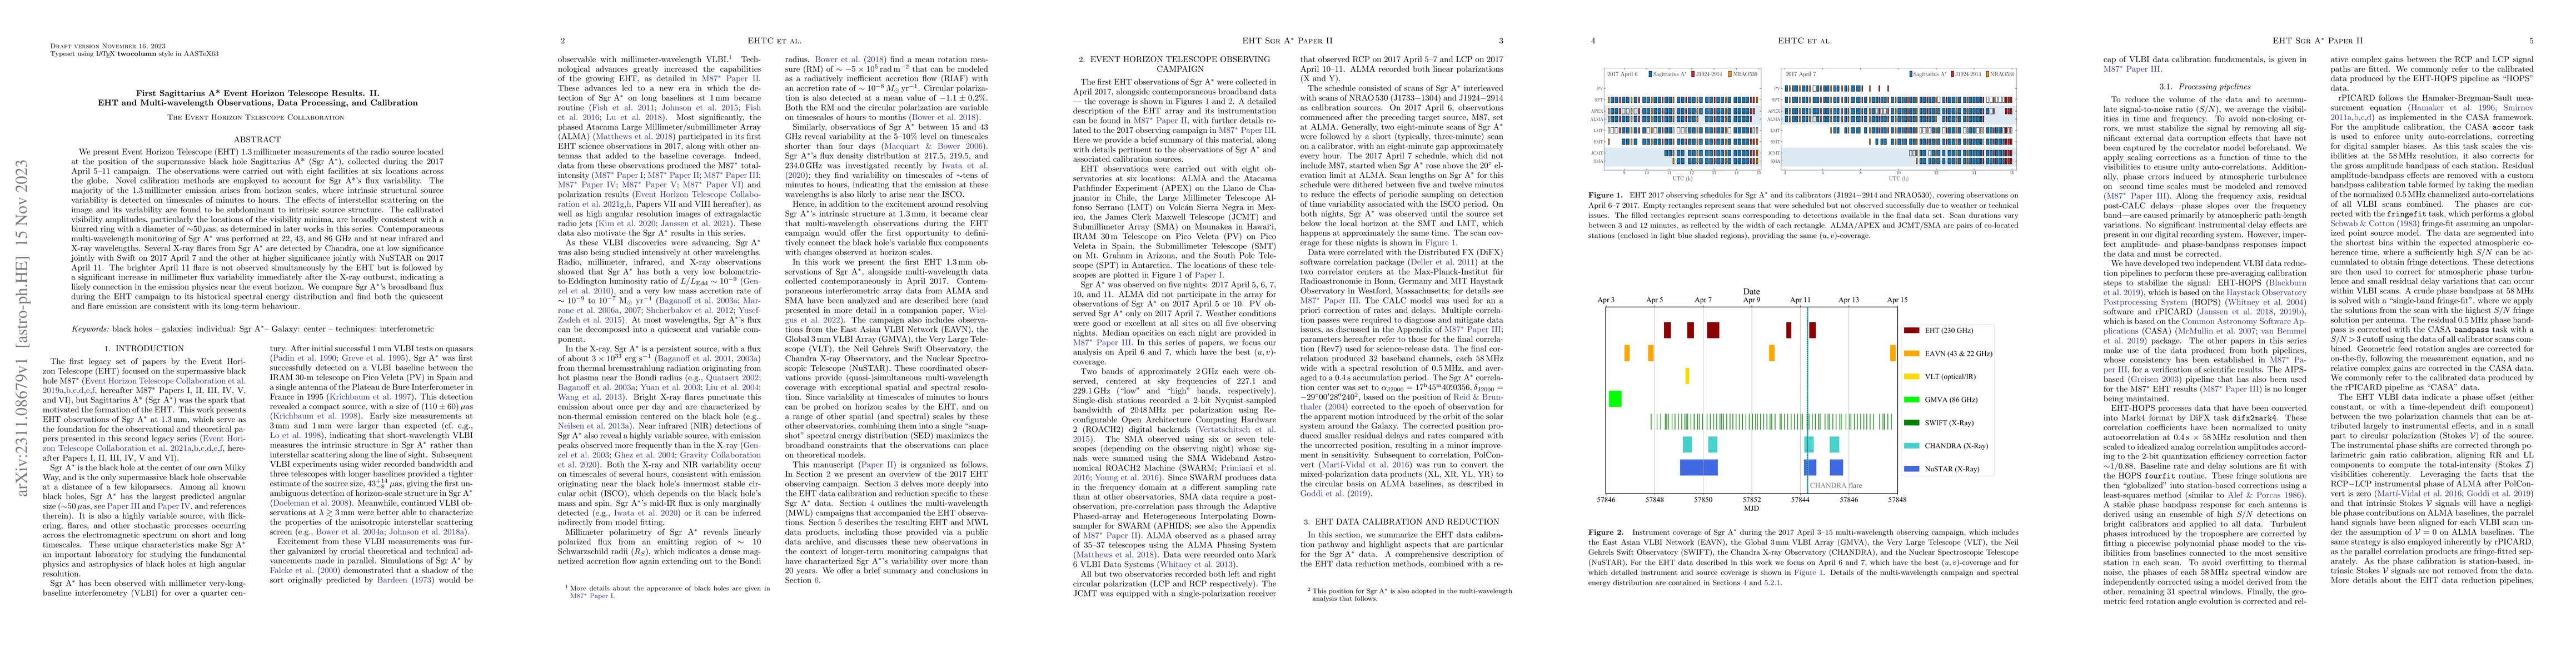
We present Event Horizon Telescope (EHT) 1.3 mm measurements of the radio source located at the position of the supermassive black hole Sagittarius A* (Sgr A*), collected during the 2017 April 5--11 campaign. The observations were carried out with eight facilities at six locations across the globe. Novel calibration methods are employed to account for Sgr A*'s flux variability. The majority of the 1.3 mm emission arises from horizon scales, where intrinsic structural source variability is detected on timescales of minutes to hours. The effects of interstellar scattering on the image and its variability are found to be subdominant to intrinsic source structure. The calibrated visibility amplitudes, particularly the locations of the visibility minima, are broadly consistent with a blurred ring with a diameter of $\sim$50 $\mu$as, as determined in later works in this series. Contemporaneous multi-wavelength monitoring of Sgr A* was performed at 22, 43, and 86 GHz and at near infrared and X-ray wavelengths. Several X-ray flares from Sgr A* are detected by Chandra, one at low significance jointly with Swift on 2017 April 7 and the other at higher significance jointly with NuSTAR on 2017 April 11. The brighter April 11 flare is not observed simultaneously by the EHT but is followed by a significant increase in millimeter flux variability immediately after the X-ray outburst, indicating a likely connection in the emission physics near the event horizon. We compare Sgr A*'s broadband flux during the EHT campaign to its historical spectral energy distribution and find both the quiescent and flare emission are consistent with its long-term behaviour.
AI Key Findings
Get AI-generated insights about this paper's methodology, results, significance, and more — seven facets brought into focus.
Impact
Paper Details
Authors
PDF Preview
Key Terms
Citation Network
Current paper (gray), citations (green), references (blue)
Display is limited for performance on very large graphs.
Discussion 0