Publication
Published:
May 20, 2015
Updated:
Jun 01, 2025
Categories:
astro-ph.SR
Metrics
Citations:
7
Source:
ArXiv
Paper Preview
Abstract
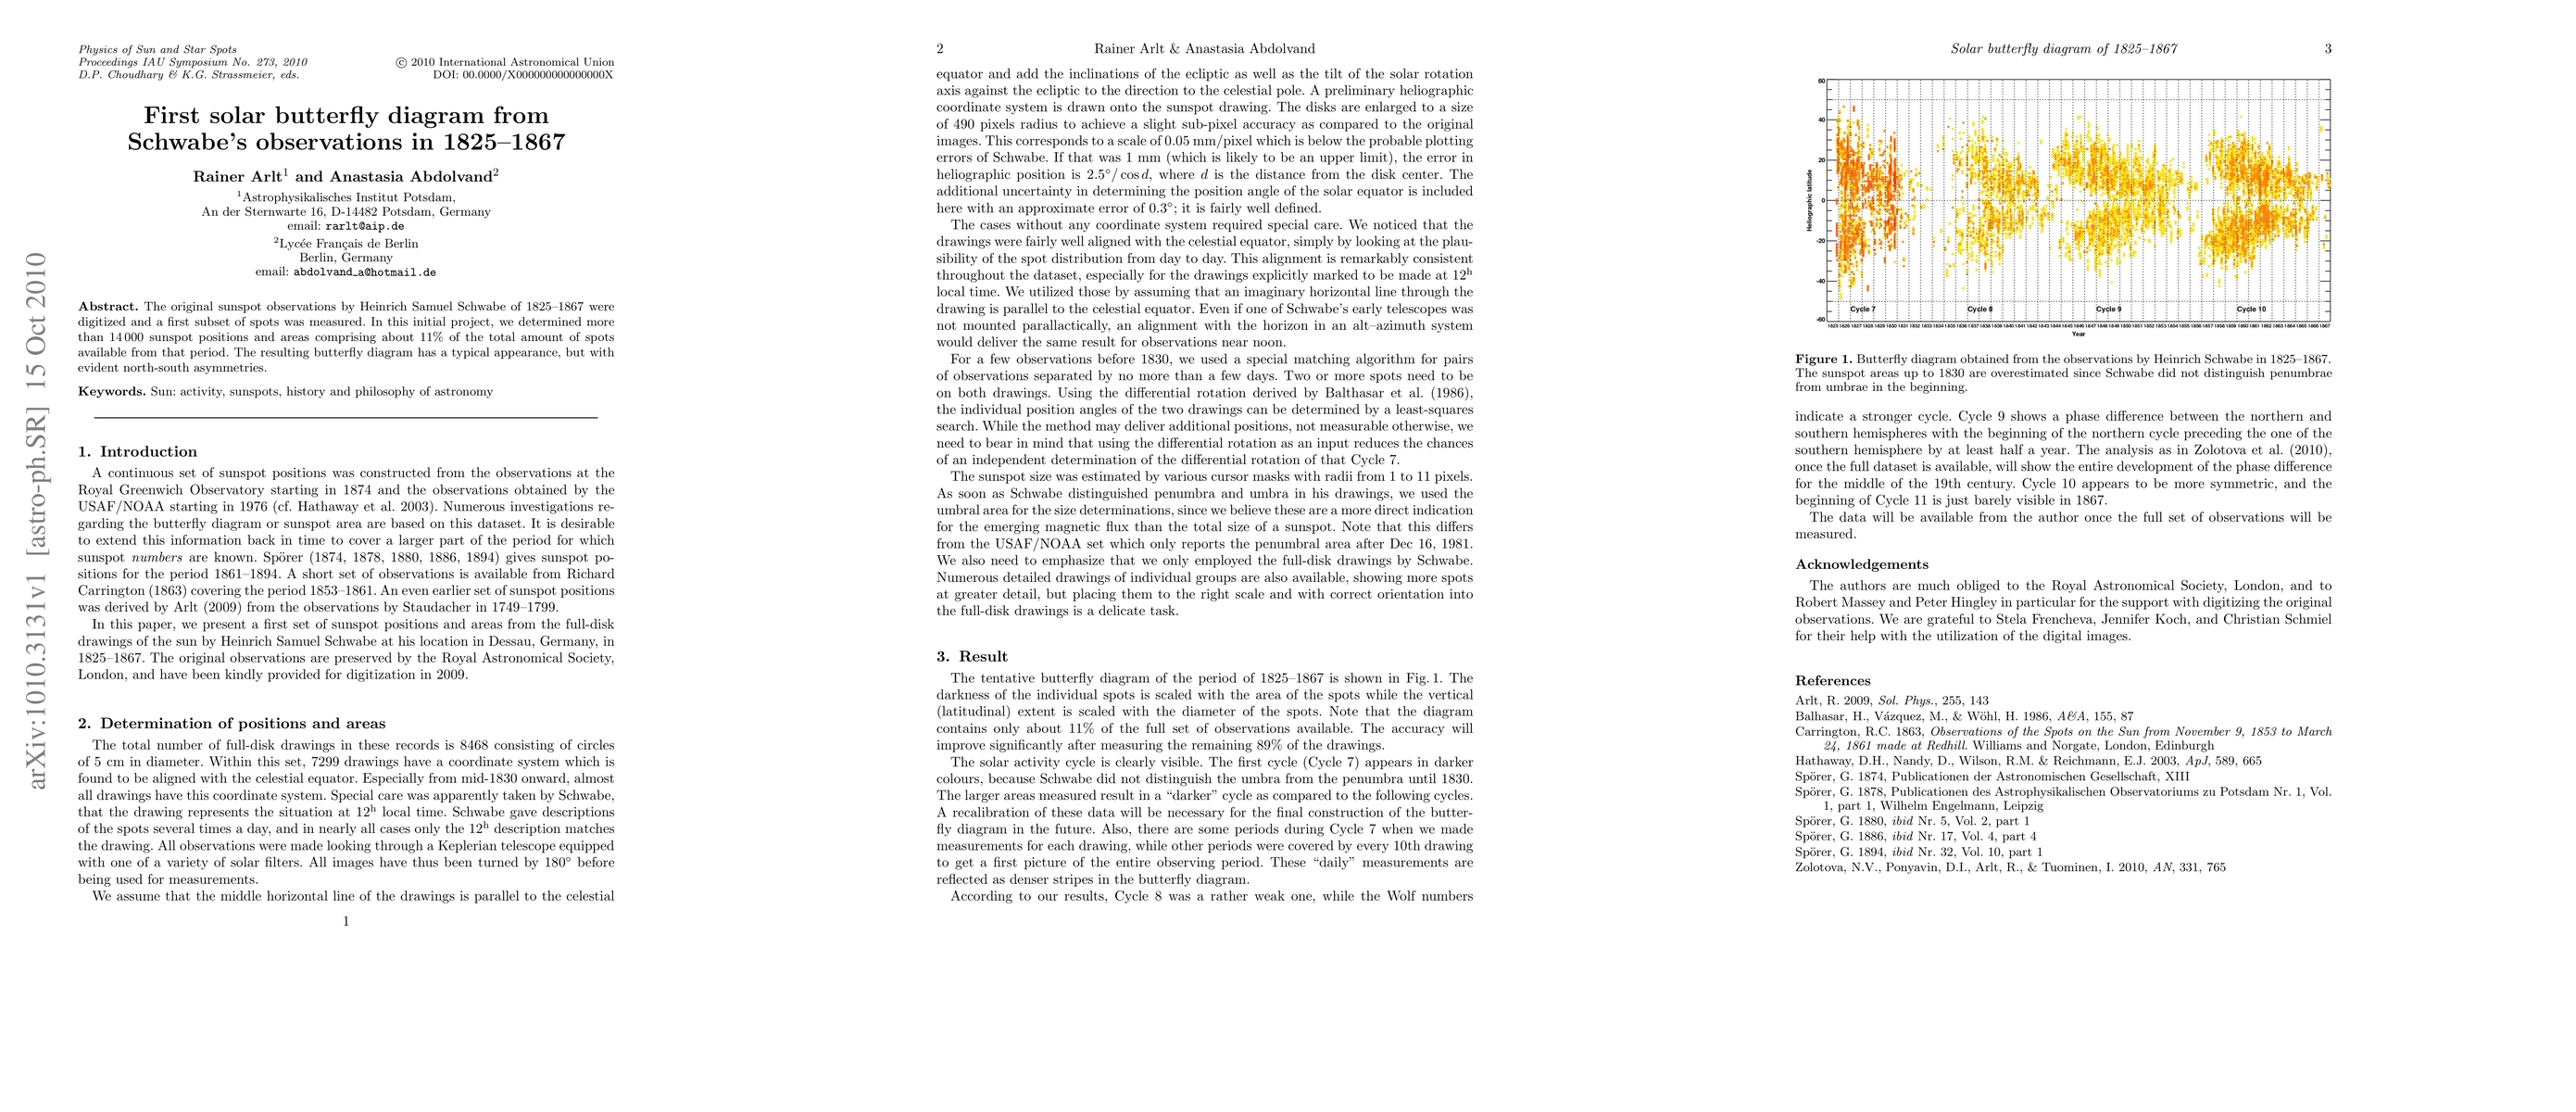
The original sunspot observations by Heinrich Samuel Schwabe of 1825-1867 were digitized and a first subset of spots was measured. In this initial project, we determined more than 14 000 sunspot positions and areas comprising about 11% of the total amount of spots available from that period. The resulting butterfly diagram has a typical appearance, but with evident north-south asymmetries.
AI Key Findings
Get AI-generated insights about this paper's methodology, results, significance, and more — seven facets brought into focus.
Impact
7
Citations
3
References
Paper Details
Paper ID:
1010.3131
License:
http://arxiv.org/licenses/nonexclusive-distrib/1.0/
Comments:
3 pages, 1 figure, Proceedings of IAU symposium 273, Physics of Sun
and star spots, Ventura, California 22-26 August 2010
Categories:
astro-ph.SR
PDF Preview
Key Terms
sunspot
(0.494)
spots
(0.489)
asymmetries
(0.292)
south
(0.253)
asymmetries
(0.250)
north
(0.250)
appearance
(0.246)
positions
(0.241)
Citation Network
Current paper (gray), citations (green), references (blue)
Display is limited for performance on very large graphs.
Current Paper
Citations
References
Click to view
Discussion 0