Fitting Graphical Interaction Models to Multivariate Time Series
Publication
Metrics
AI Quick Summary
This paper introduces a parametric approach for fitting graphical interaction models to multivariate time series, generalizing covariance selection models. The proposed models, formulated in terms of inverse covariances, correspond to vector autoregressive models under conditional independence constraints, and an iterative method based on Whittle's approximation is presented for maximum likelihood estimation.
Paper Preview
Abstract
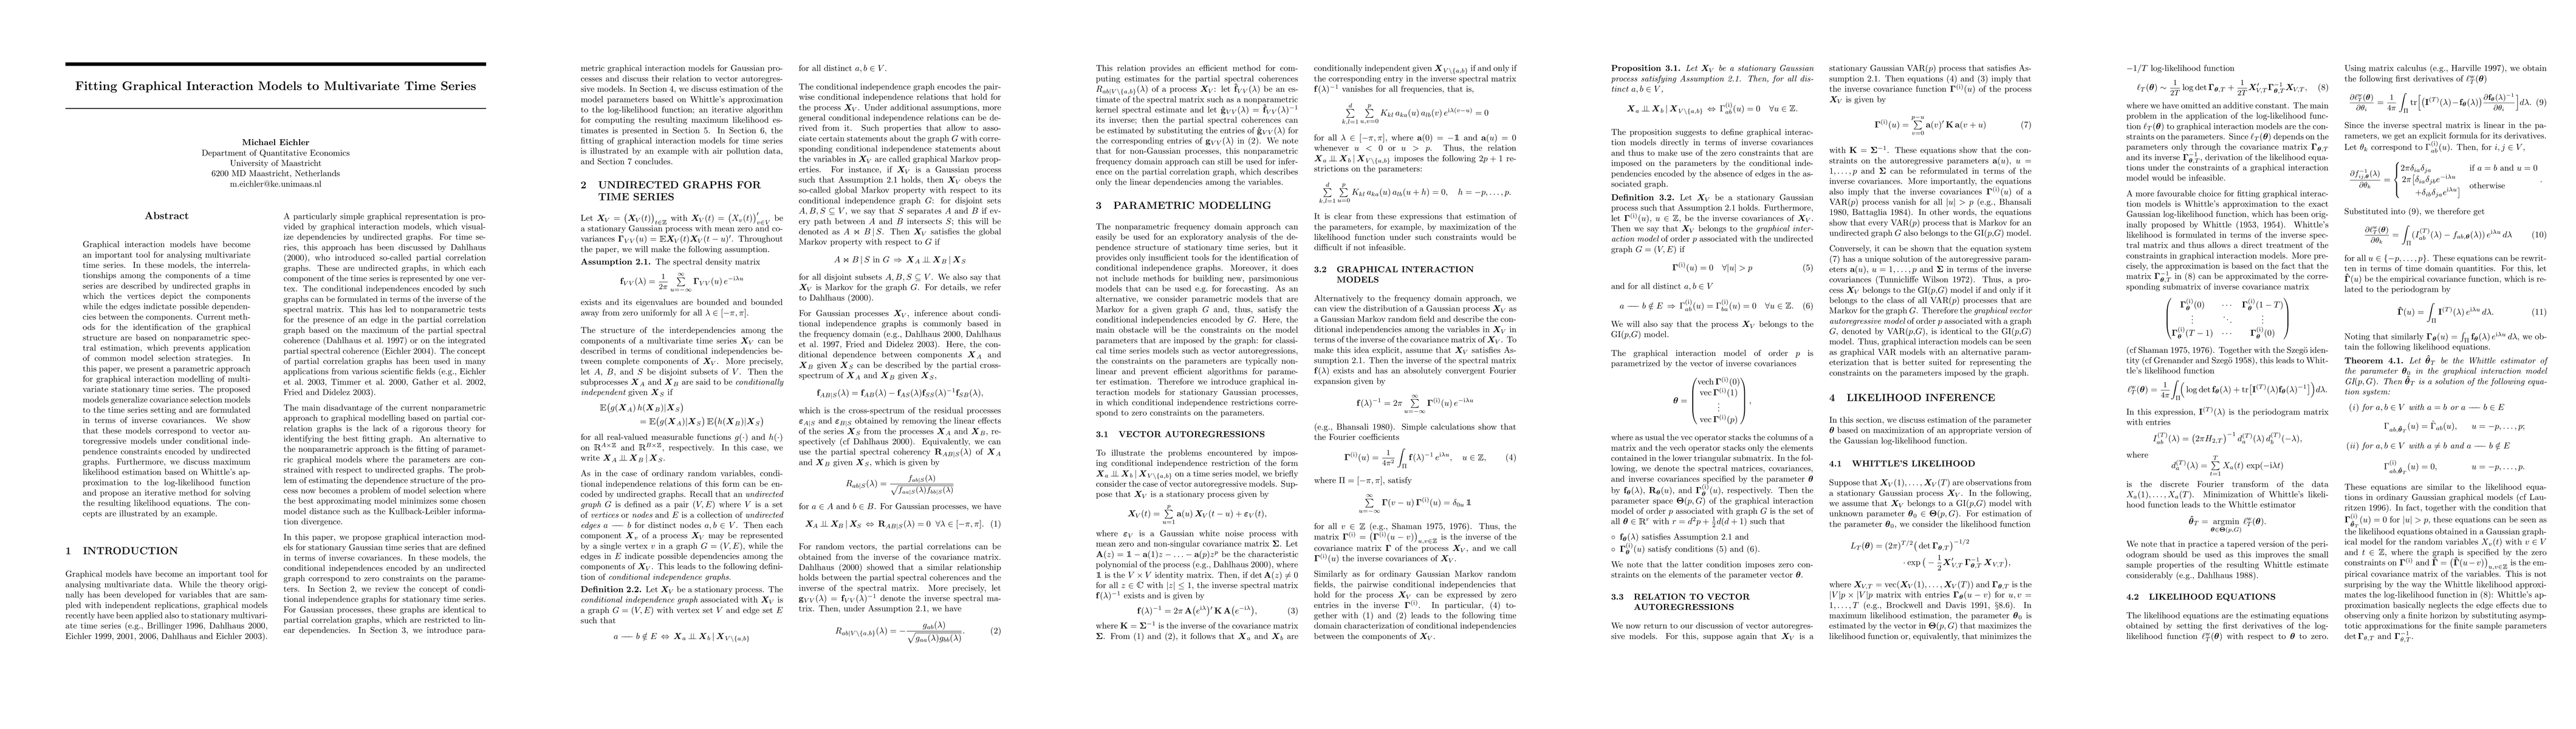
Graphical interaction models have become an important tool for analysing multivariate time series. In these models, the interrelationships among the components of a time series are described by undirected graphs in which the vertices depict the components while the edges indictate possible dependencies between the components. Current methods for the identification of the graphical structure are based on nonparametric spectral stimation, which prevents application of common model selection strategies. In this paper, we present a parametric approach for graphical interaction modelling of multivariate stationary time series. The proposed models generalize covariance selection models to the time series setting and are formulated in terms of inverse covariances. We show that these models correspond to vector autoregressive models under conditional independence constraints encoded by undirected graphs. Furthermore, we discuss maximum likelihood estimation based on Whittle's approximation to the log-likelihood function and propose an iterative method for solving the resulting likelihood equations. The concepts are illustrated by an example.
AI Key Findings
Get AI-generated insights about this paper's methodology, results, significance, and more — seven facets brought into focus.
Impact
Paper Details
PDF Preview
Key Terms
Citation Network
Current paper (gray), citations (green), references (blue)
Display is limited for performance on very large graphs.
Discussion 0