Summary
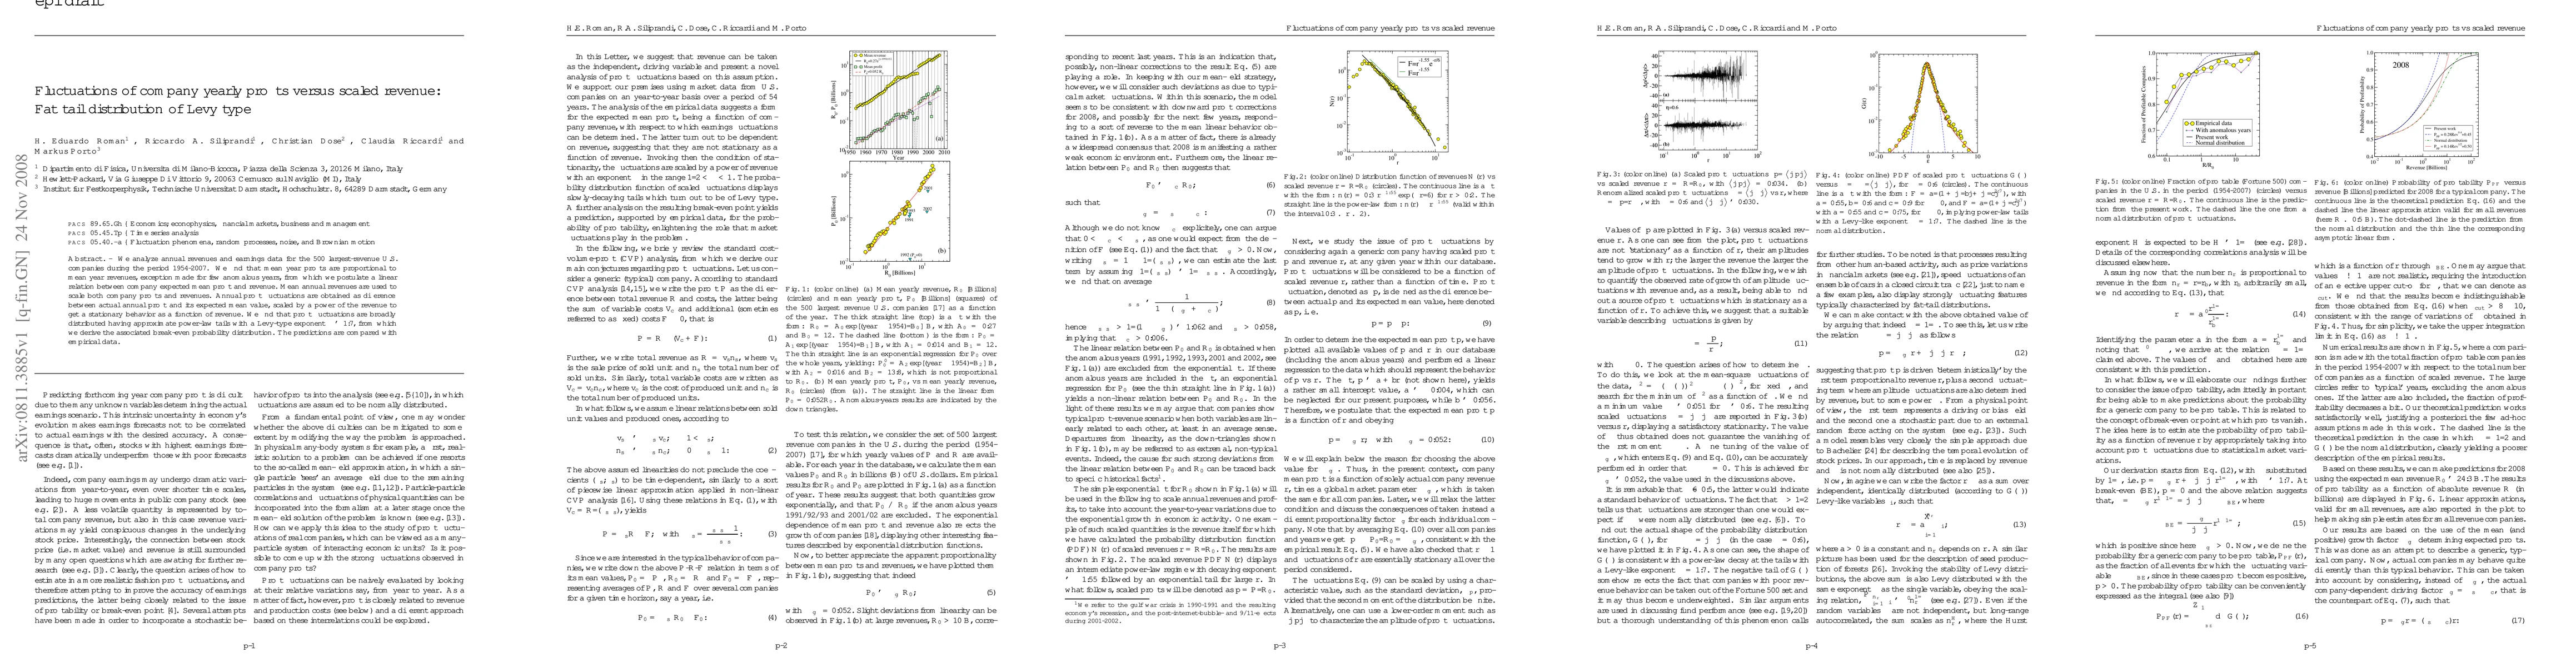
We analyze annual revenues and earnings data for the 500 largest-revenue U.S. companies during the period 1954-2007. We find that mean year profits are proportional to mean year revenues, exception made for few anomalous years, from which we postulate a linear relation between company expected mean profit and revenue. Mean annual revenues are used to scale both company profits and revenues. Annual profit fluctuations are obtained as difference between actual annual profit and its expected mean value, scaled by a power of the revenue to get a stationary behavior as a function of revenue. We find that profit fluctuations are broadly distributed having approximate power-law tails with a Levy-type exponent $\alpha \simeq 1.7$, from which we derive the associated break-even probability distribution. The predictions are compared with empirical data.
AI Key Findings
Get AI-generated insights about this paper's methodology, results, and significance.
Paper Details
PDF Preview
Key Terms
Citation Network
Current paper (gray), citations (green), references (blue)
Display is limited for performance on very large graphs.
No citations found for this paper.
Comments (0)