Summary
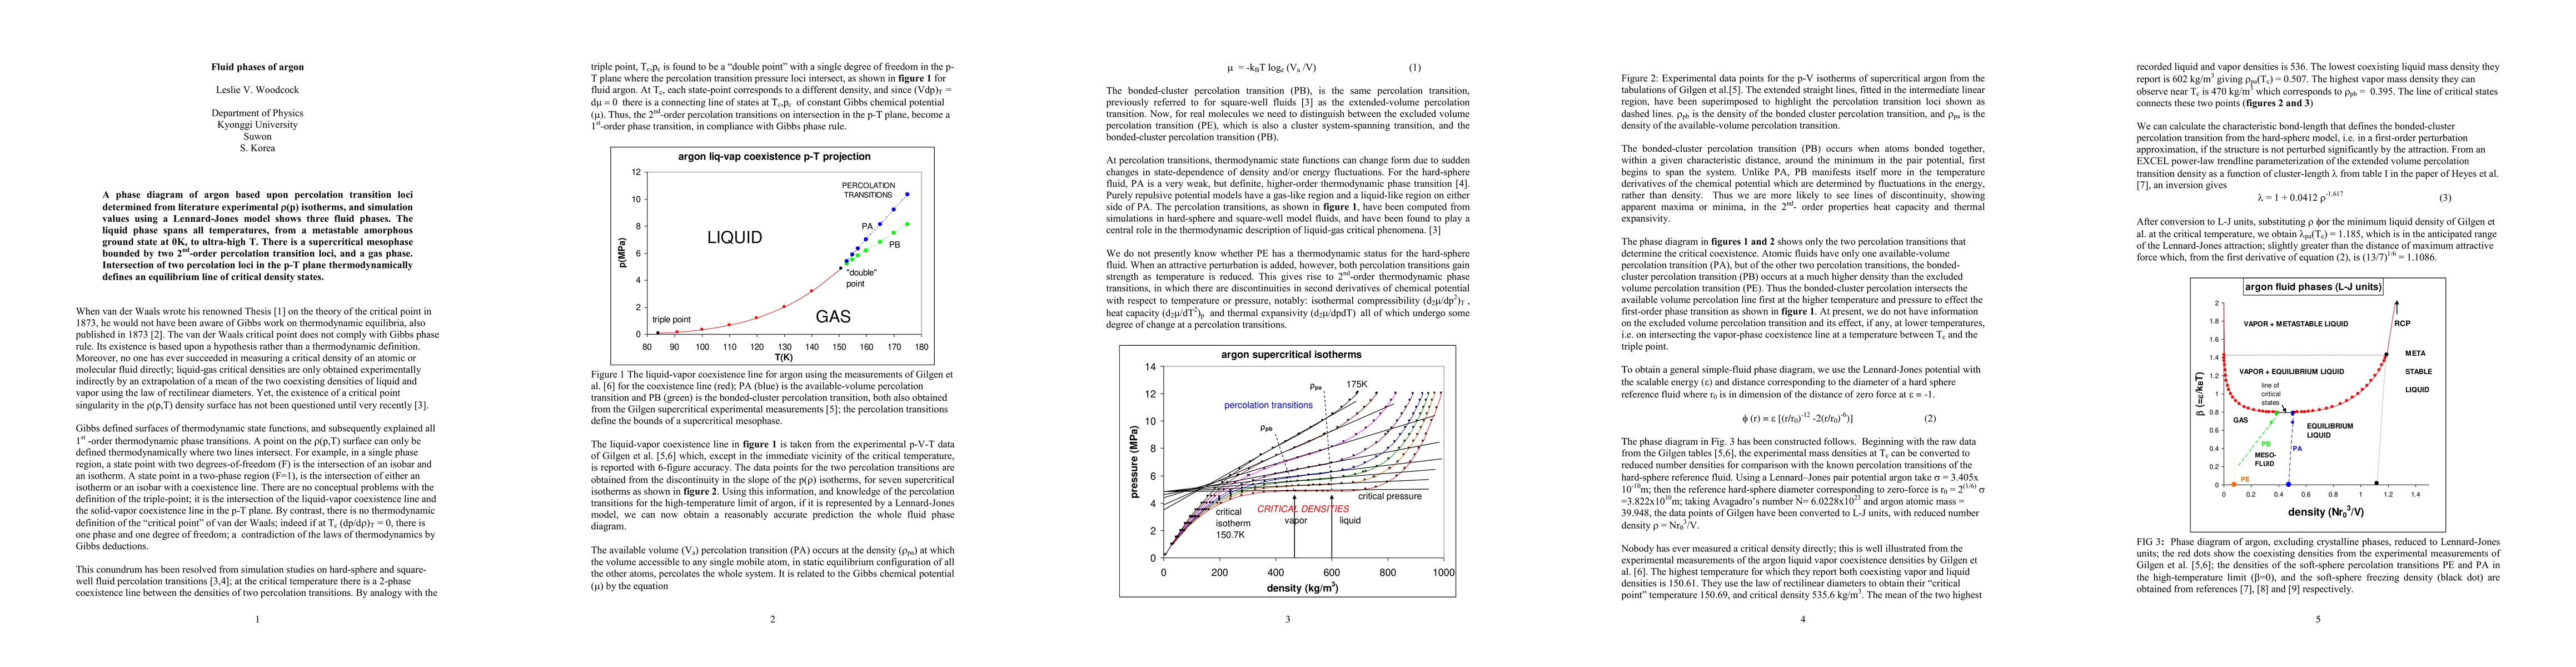
A phase diagram of argon based upon percolation transition loci determined from literature experimental density-pressure isotherms, and simulation values using a Lennard-Jones model shows three fluid phases. The liquid phase spans all temperatures, from a metastable amorphous ground state at 0K, to ultra-high T. There is a supercritical mesophase bounded by two 2nd-order percolation transition loci, and a gas phase. Intersection of two percolation loci in the p-T plane thermodynamically defines an equilibrium line of critical density states.
AI Key Findings
Get AI-generated insights about this paper's methodology, results, and significance.
Paper Details
PDF Preview
Key Terms
Citation Network
Current paper (gray), citations (green), references (blue)
Display is limited for performance on very large graphs.
Similar Papers
Found 4 papers| Title | Authors | Year | Actions |
|---|
Comments (0)