Forecasting formation of a Tropical Cyclone Using Reanalysis Data
Publication
Metrics
AI Quick Summary
This study proposes a deep learning model to forecast tropical cyclone formation using high-resolution ERA5 reanalysis data and IBTrACS best track data, achieving an accuracy of 86.9% - 92.9% for a 60-hour lead time across six ocean basins. The model trains in 5-15 minutes and predicts in seconds, making it suitable for real-time applications.
Paper Preview
Abstract
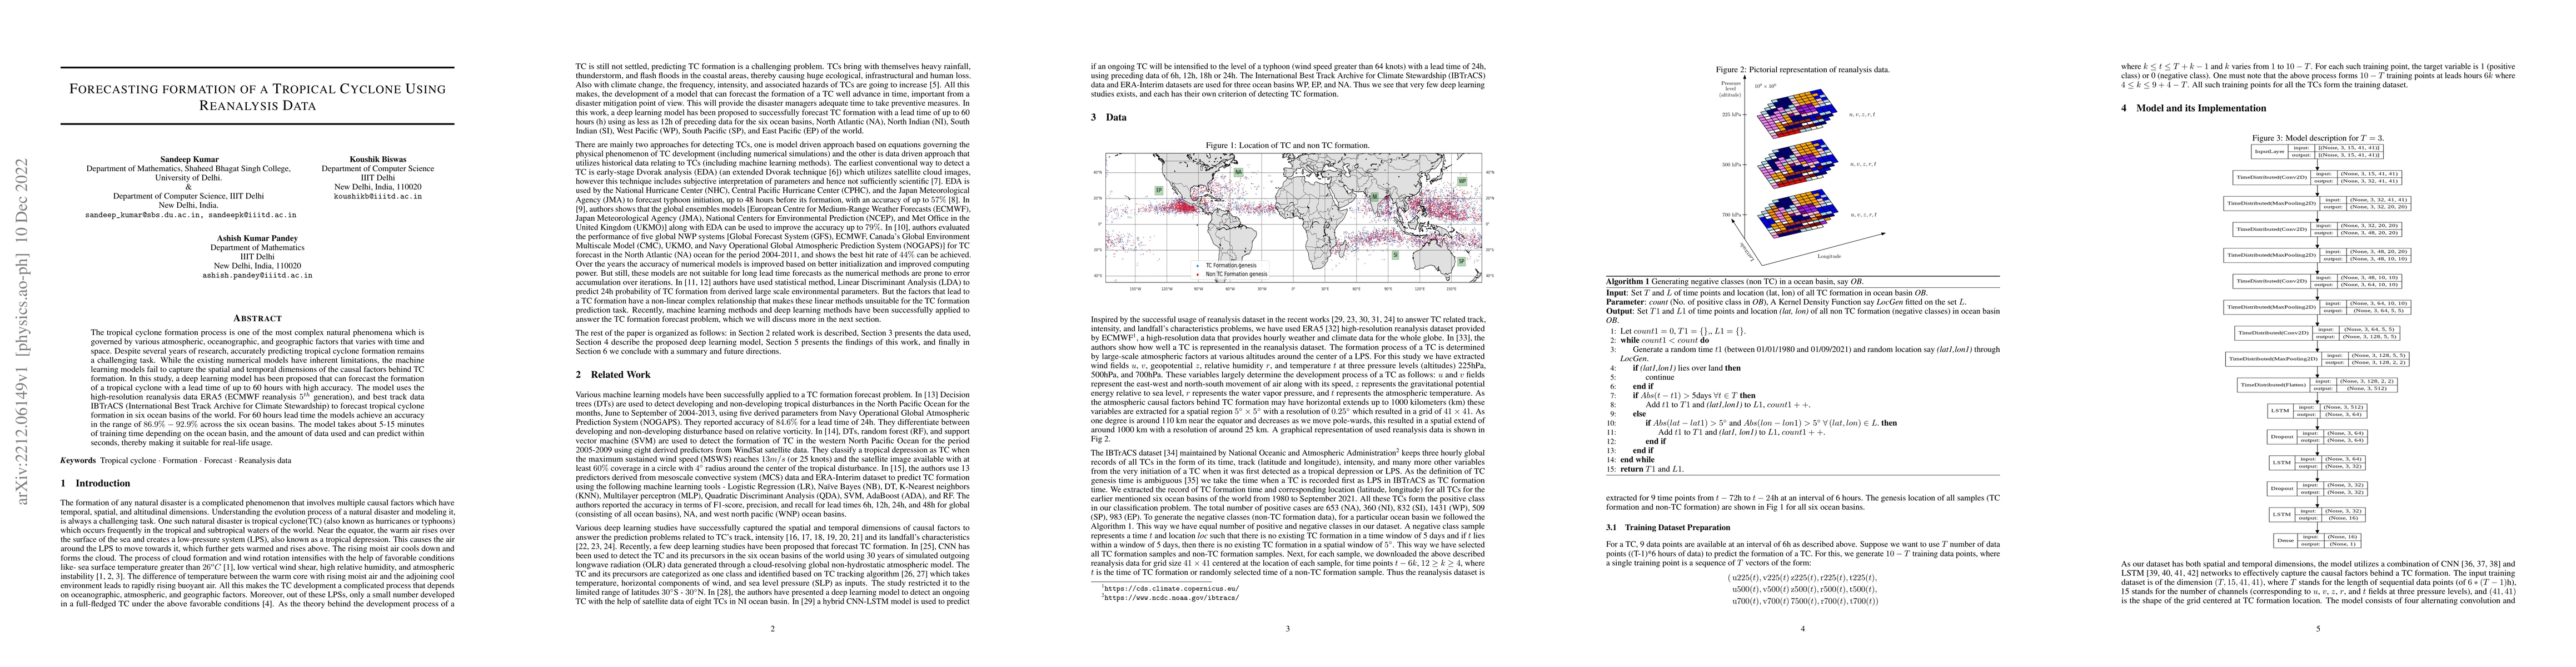
The tropical cyclone formation process is one of the most complex natural phenomena which is governed by various atmospheric, oceanographic, and geographic factors that varies with time and space. Despite several years of research, accurately predicting tropical cyclone formation remains a challenging task. While the existing numerical models have inherent limitations, the machine learning models fail to capture the spatial and temporal dimensions of the causal factors behind TC formation. In this study, a deep learning model has been proposed that can forecast the formation of a tropical cyclone with a lead time of up to 60 hours with high accuracy. The model uses the high-resolution reanalysis data ERA5 (ECMWF reanalysis 5th generation), and best track data IBTrACS (International Best Track Archive for Climate Stewardship) to forecast tropical cyclone formation in six ocean basins of the world. For 60 hours lead time the models achieve an accuracy in the range of 86.9% - 92.9% across the six ocean basins. The model takes about 5-15 minutes of training time depending on the ocean basin, and the amount of data used and can predict within seconds, thereby making it suitable for real-life usage.
AI Key Findings
Get AI-generated insights about this paper's methodology, results, significance, and more — seven facets brought into focus.
Impact
Paper Details
Authors
PDF Preview
Key Terms
Citation Network
Current paper (gray), citations (green), references (blue)
Display is limited for performance on very large graphs.
Discussion 0