Foresight is a system designed to assist users in rapidly discovering visual insights from large, high-dimensional datasets by automatically identifying and presenting strong statistical properties. It enables users to explore the space of insights through interactive queries and global views, rather than navigating data dimensions and visual encodings.
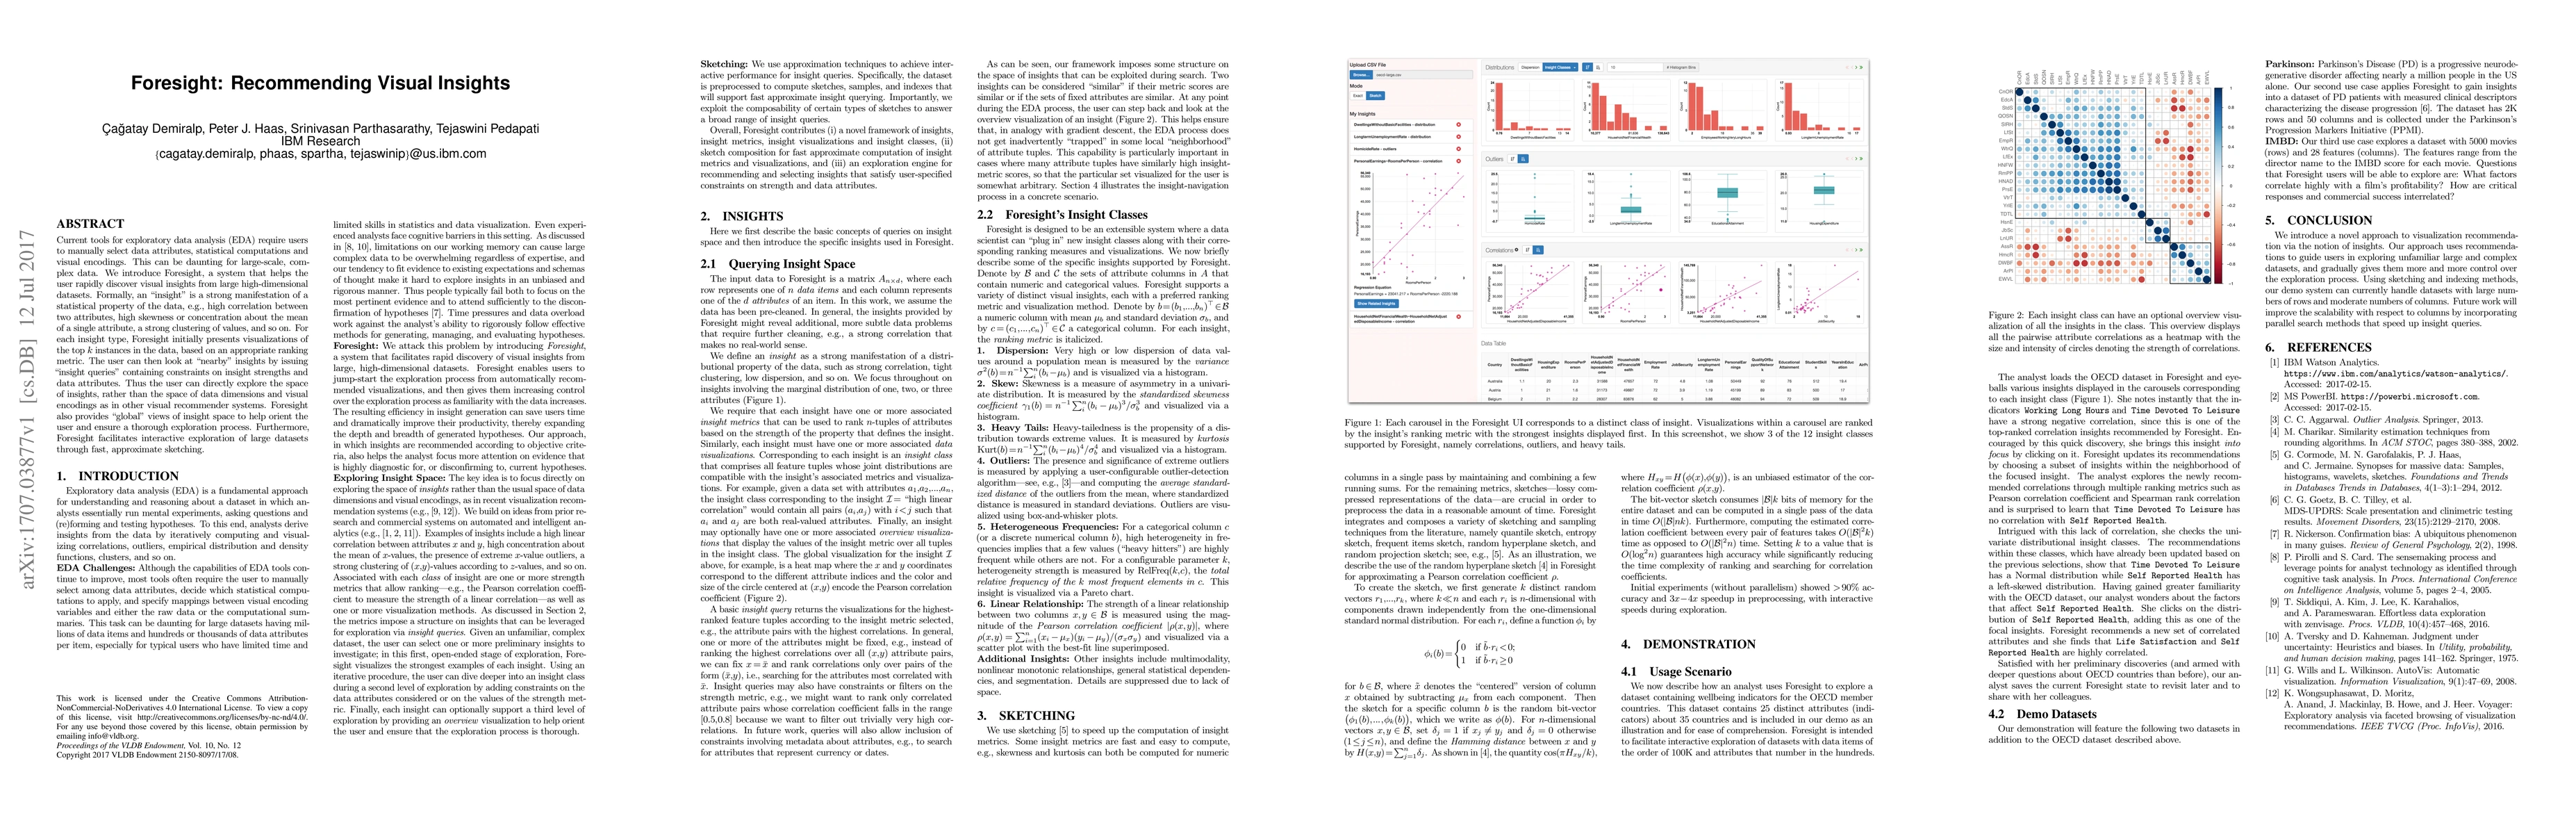
Current tools for exploratory data analysis (EDA) require users to manually select data attributes, statistical computations and visual encodings. This can be daunting for large-scale, complex data. We introduce Foresight, a system that helps the user rapidly discover visual insights from large high-dimensional datasets. Formally, an "insight" is a strong manifestation of a statistical property of the data, e.g., high correlation between two attributes, high skewness or concentration about the mean of a single attribute, a strong clustering of values, and so on. For each insight type, Foresight initially presents visualizations of the top k instances in the data, based on an appropriate ranking metric. The user can then look at "nearby" insights by issuing "insight queries" containing constraints on insight strengths and data attributes. Thus the user can directly explore the space of insights, rather than the space of data dimensions and visual encodings as in other visual recommender systems. Foresight also provides "global" views of insight space to help orient the user and ensure a thorough exploration process. Furthermore, Foresight facilitates interactive exploration of large datasets through fast, approximate sketching.
This graph shows how this paper is connected to other research. The current paper is shown in dark gray, papers that cite it are in green, and papers it references are in blue. You can:
• Hover over any node to see the paper title
• Click a node to view that paper's details
• Drag nodes to rearrange the graph
• Use the zoom controls (bottom right) to zoom in/out
Title | Authors | Year | Actions |
---|---|---|---|
Data Insights as Data: Quick Overview and Exploration of Automated Data Insights
|
Shangxuan Wu, Wendi Luan, Yong Wang, Dan Zeng, Qiaomu Shen, Bo Tang
|
2025
|
View Paper |
VisPath: Automated Visualization Code Synthesis via Multi-Path Reasoning and Feedback-Driven Optimization
|
Wonduk Seo, Seungyong Lee, Daye Kang, Zonghao Yuan, Seunghyun Lee
|
2025
|
View Paper |
FactExplorer: Fact Embedding-Based Exploratory Data Analysis for Tabular Data
|
Qi Jiang, Guodao Sun, Yue Dong, Lvhan Pan, Baofeng Chang, Li Jiang, Haoran Liang, Ronghua Liang
|
2025
|
View Paper |
Pluto: Authoring Semantically Aligned Text and Charts for Data-Driven Communication
|
Arjun Srinivasan, V. Setlur, Arvind Satyanarayan
|
2025
|
View Paper |
DataTales: A Benchmark for Real-World Intelligent Data Narration
|
Yajing Yang, Qian Liu, Min-Yen Kan
|
2024
|
View Paper |
QUIS: Question-guided Insights Generation for Automated Exploratory Data Analysis
|
Abhijit Manatkar, Ashlesha Akella, Parthivi Gupta, Krishnasuri Narayanam
|
2024
|
View Paper |
Groot: A System for Editing and Configuring Automated Data Insights
|
Sneha Gathani, Anamaria Crisan, V. Setlur, Arjun Srinivasan
|
2024
|
View Paper |
RSVP for VPSA : A Meta Design Study on Rapid Suggestive Visualization Prototyping for Visual Parameter Space Analysis
|
Manfred Klaffenboeck, Michael Gleicher, Johannes Sorger, Michael Wimmer, Torsten Moeller
|
2024
|
View Paper |
Beyond Data, Towards Sustainability: A Sydney Case Study on Urban Digital Twins
|
Ammar Sohail, Bojie Shen, Muhammad Aamir Cheema, Mohammed Eunus Ali, Anwaar Ulhaq, M. A. Babar, Asama Qureshi
|
2024
|
View Paper |
Automated Recommendation of Aggregate Visualizations for Crowdfunding Data
|
Mohamed A. Sharaf, Heba Helal, Nazar Zaki, Wadha Alketbi, Latifa Alkaabi, Sara Alshamsi, Fatmah Alhefeiti
|
2024
|
View Paper |
AVA: An automated and AI-driven intelligent visual analytics framework
|
Jiazhe Wang, Xi Li, Chenlu Li, Di Peng, Arran Zeyu Wang, Yuhui Gu, Xingui Lai, Haifeng Zhang, Xinyue Xu, Xiaoqing Dong, Zhifeng Lin, Jiehui Zhou, Xingyu Liu, Wei Chen
|
2024
|
View Paper |
InsigHTable: Insight-driven Hierarchical Table Visualization with Reinforcement Learning
|
Guozheng Li, Peng He, Xinyu Wang, Runfei Li, Chi Harold Liu, Chuangxin Ou, Dong He, Guoren Wang
|
2024
|
View Paper |
Understanding and Automating Graphical Annotations on Animated Scatterplots
|
Danqing Shi, Antti Oulasvirta, T. Weinkauf, Nan Cao
|
2024
|
View Paper |
CoInsight: Visual Storytelling for Hierarchical Tables With Connected Insights
|
Guozheng Li, Runfei Li, Yunshan Feng, Yu Zhang, Yuyu Luo, Chi Harold Liu
|
2024
|
View Paper |
Struggles and Strategies in Understanding Information Visualizations
|
Maryam Rezaie, M. Tory, Sheelagh Carpendale
|
2024
|
View Paper |
Qutaber: task-based exploratory data analysis with enriched context awareness
|
Qi Jiang, Guodao Sun, Tong Li, Jingwei Tang, Wang Xia, Sujia Zhu, Ronghua Liang
|
2024
|
View Paper |
How do Categorical Duplicates Affect ML? A New Benchmark and Empirical Analyses
|
Vraj Shah, Thomas J. Parashos, Arun Kumar
|
2024
|
View Paper |
Data-Driven Insight Synthesis for Multi-Dimensional Data
|
Junjie Xing, Xinyu Wang, H. V. Jagadish
|
2024
|
View Paper |
Visual Insight Recommendation: From Ranking Insight Visualizations to Insight Types
|
Camille Harris, Ryan A. Rossi, Sana Malik, J. Hoffswell, Fan Du, Tak Yeon Lee, E. Koh, Handong Zhao
|
2023
|
View Paper |
Azimuth: Designing Accessible Dashboards for Screen Reader Users
|
Arjun Srinivasan, Tim Harshbarger, Darrell Hilliker, Jennifer Mankoff
|
2023
|
View Paper |
LLM4Vis: Explainable Visualization Recommendation using ChatGPT
|
Lei Wang, Songheng Zhang, Yun Wang, Ee-Peng Lim, Yong Wang
|
2023
|
View Paper |
AdaVis: Adaptive and Explainable Visualization Recommendation for Tabular Data
|
Songheng Zhang, Y. Wang, Haotian Li, Huamin Qu
|
2023
|
View Paper |
Too Many Cooks: Exploring How Graphical Perception Studies Influence Visualization Recommendations in Draco
|
Zehua Zeng, Junran Yang, Dominik Moritz, Jeffrey Heer, L. Battle
|
2023
|
View Paper |
Draco 2: An Extensible Platform to Model Visualization Design
|
Junran Yang, P'eter Ferenc Gyarmati, Zehua Zeng, Dominik Moritz
|
2023
|
View Paper |
Lodestar: Supporting rapid prototyping of data science workflows through data-driven analysis recommendations
|
Deepthi Raghunandan, Zhe Cui, Kartik Krishnan, Segen Tirfe, Shenzhi Shi, Tejaswi Darshan Shrestha, L. Battle, N. Elmqvist
|
2023
|
View Paper |
Calliope-Net: Automatic Generation of Graph Data Facts via Annotated Node-Link Diagrams
|
Qing Chen, Nan Chen, W. Shuai, Guande Wu, Zhe Xu, H. Tong, Nana Cao
|
2023
|
View Paper |
Dead or Alive: Continuous Data Profiling for Interactive Data Science
|
Will Epperson, Vaishnavi Gorantla, Dominik Moritz, Adam Perer
|
2023
|
View Paper |
Eight years of AutoML: categorisation, review and trends
|
Rafael Barbudo, S. Ventura, J. Romero
|
2023
|
View Paper |
Olio: A Semantic Search Interface for Data Repositories
|
V. Setlur, Andriy Kanyuka, Arjun Srinivasan
|
2023
|
View Paper |
What Exactly is an Insight? A Literature Review
|
L. Battle, Alvitta Ottley
|
2023
|
View Paper |
Electricity sector resilience in response to extreme weather and climate-related events: Tools and datasets
|
H. Ashrafi, Tarannom Parhizkar
|
2023
|
View Paper |
Enabling Spatial Digital Twins: Technologies, Challenges, and Future Research Directions
|
Mohammed Eunus Ali, M. A. Cheema, T. Hashem, A. Ulhaq, M. Babar
|
2023
|
View Paper |
SpotLight: Visual Insight Recommendation
|
Camille Harris, R. Rossi, Sana Malik, J. Hoffswell, F. Du, Tak Yeon Lee, E. Koh, Handong Zhao
|
2023
|
View Paper |
GraphDescriptor: Augmenting Node-Link Diagrams With Textual Descriptions
|
Jiacheng Pan, Zihan Yan, Zihan Zhou, Xiaodong Zhao, Shenghui Cheng, Dongming Han, Jian Chen, Mingliang Xu, Wei Chen
|
2023
|
View Paper |
NetworkNarratives: Data Tours for Visual Network Exploration and Analysis
|
Wenchao Li, Sarah Schöttler, James Scott-Brown, Yun Wang, Siming Chen, Huamin Qu, Benjamin Bach
|
2023
|
View Paper |
Agnostic Visual Recommendation Systems: Open Challenges and Future Directions
|
L. Podo, Bardh Prenkaj, P. Velardi
|
2023
|
View Paper |
Explainable data transformation recommendation for automatic visualization
|
Ziliang Wu, Wei Chen, Yuxin Ma, Tong Xu, Fan Yan, Lei Lv, Zhonghao Qian, Jiazhi Xia
|
2022
|
View Paper |
Active Pattern Classification for Automatic Visual Exploration of Multi-Dimensional Data
|
J. Li, Huailian Tan, Wentao Huang
|
2022
|
View Paper |
An intelligent approach to automatically discovering visual insights
|
Yuhua Zhou, Xiyu Meng, Yanhong Wu, Tan Tang, Yongheng Wang, Yingcai Wu
|
2022
|
View Paper |
MVST-SciVis: narrative visualization and analysis of compound events in scientific data
|
Xuyi Lu, Yuan Xu, Guan Li, Yi Chen, Guihua Shan
|
2022
|
View Paper |
GALVIS: Visualization Construction through Example-Powered Declarative Programming
|
Leixian Shen, Enya Shen, Zhiwei Tai, Yun Wang, Yuyu Luo, Jianmin Wang
|
2022
|
View Paper |
Comparing Visual Encodings for the Task of Anomaly Detection
|
Meirav Taieb-Maimon, Eden Ya’akobi, Nevo Itzhak, Yossi Zaltsman
|
2022
|
View Paper |
Erato: Cooperative Data Story Editing via Fact Interpolation
|
Mengdi Sun, Ligan Cai, Weiwei Cui, Yanqiu Wu, Yang Shi, Nan Cao
|
2022
|
View Paper |
M: Intent-based Recommendations to Support Dashboard Composition
|
Aditeya Pandey, Arjun Srinivasan, V. Setlur
|
2022
|
View Paper |
ASTA: Learning Analytical Semantics over Tables for Intelligent Data Analysis and Visualization
|
Lingbo Li, Tianle Li, Xinyi He, Mengyu Zhou, Shi Han, Dongmei Zhang
|
2022
|
View Paper |
What Do We Mean When We Say “Insight”? A Formal Synthesis of Existing Theory
|
L. Battle, Alvitta Ottley
|
2022
|
View Paper |
Visual Data Analysis with Task-Based Recommendations
|
Leixian Shen, Enya Shen, Zhiwei Tai, Yihao Xu, Jiaxiang Dong, Jianmin Wang
|
2022
|
View Paper |
VisGNN: Personalized Visualization Recommendationvia Graph Neural Networks
|
Fayokemi Ojo, Ryan A. Rossi, J. Hoffswell, Shunan Guo, F. Du, Sungchul Kim, Chang Xiao, Eunyee Koh
|
2022
|
View Paper |
Lodestar: Supporting Independent Learning and Rapid Experimentation Through Data-Driven Analysis Recommendations
|
Deepthi Raghunandan, Zhe Cui, K. Sivaramakrishnan, Segen Tirfe, Shenzhi Shi, Tejaswi Darshan Shrestha, L. Battle, N. Elmqvist
|
2022
|
View Paper |
Recommendations for Visualization Recommendations: Exploring Preferences and Priorities in Public Health
|
Calvin Bao, Siyao Li, Sarah Flores, M. Correll, L. Battle
|
2022
|
View Paper |
A spiral-like method to place in the space (and interact with) too many values
|
Yannis Tzitzikas, Maria-Evangelia Papadaki, Manos Chatzakis
|
2021
|
View Paper |
Towards Natural Language Interfaces for Data Visualization: A Survey
|
Leixian Shen, Enya Shen, Yuyu Luo, Xiaocong Yang, Xuming Hu, Xiongshuai Zhang, Zhiwei Tai, Jianmin Wang
|
2021
|
View Paper |
An Evaluation-Focused Framework for Visualization Recommendation Algorithms
|
Zehua Zeng, Phoebe Moh, F. Du, J. Hoffswell, Tak Yeon Lee, Sana Malik, Eunyee Koh, L. Battle
|
2021
|
View Paper |
A Review and Collation of Graphical Perception Knowledge for Visualization Recommendation
|
Zehua Zeng, L. Battle
|
2021
|
View Paper |
Predicting intent behind selections in scatterplot visualizations
|
K. Gadhave, Jochen Görtler, Zach Cutler, C. Nobre, O. Deussen, Miriah D. Meyer, J. M. Phillips, A. Lex
|
2021
|
View Paper |
Learning to Recommend Visualizations from Data
|
Xin Qian, Ryan A. Rossi, F. Du, Sungchul Kim, Eunyee Koh, Sana Malik, Tak Yeon Lee, Joel Chan
|
2021
|
View Paper |
KG4Vis: A Knowledge Graph-Based Approach for Visualization Recommendation
|
Haotian Li, Yong Wang, Songheng Zhang, Yangqiu Song, Huamin Qu
|
2021
|
View Paper |
An Automated Approach to Reasoning About Task-Oriented Insights in Responsive Visualization
|
Hyeok Kim, Ryan A. Rossi, Abhraneel Sarma, Dominik Moritz, J. Hullman
|
2021
|
View Paper |
Boomerang: Proactive Insight-Based Recommendations for Guiding Conversational Data Analysis
|
D. Lee, A. Quamar, Eser Kandogan, Fatma Özcan
|
2021
|
View Paper |
Design Patterns and Trade‐Offs in Responsive Visualization for Communication
|
Hyeok Kim, Dominik Moritz, J. Hullman
|
2021
|
View Paper |
DataPrep.EDA: Task-Centric Exploratory Data Analysis for Statistical Modeling in Python
|
Jinglin Peng, Weiyuan Wu, Brandon Lockhart, S. Bian, J. Yan, Linghao Xu, Zhixuan Chi, Jeffrey M. Rzeszotarski, Jiannan Wang
|
2021
|
View Paper |
System Design to Utilize Domain Expertise for Visual Exploratory Data Analysis
|
Tristan Langer, Tobias Meisen
|
2021
|
View Paper |
Insight-centric Visualization Recommendation
|
Camille Harris, Ryan A. Rossi, Sana Malik, J. Hoffswell, F. Du, Tak Yeon Lee, Eunyee Koh, Handong Zhao
|
2021
|
View Paper |
Personalized Visualization Recommendation
|
Xin-Yao Qian, Ryan A. Rossi, F. Du, Sungchul Kim, Eunyee Koh, Sana Malik, Tak Yeon Lee, Nesreen K. Ahmed
|
2021
|
View Paper |
AI4VIS: Survey on Artificial Intelligence Approaches for Data Visualization
|
Aoyu Wu, Yun Wang, Xinhuan Shu, Dominik Moritz, Weiwei Cui, Haidong Zhang, Dongmei Zhang, Huamin Qu
|
2021
|
View Paper |
A scalable "exploranation" technique for hierarchically indexed table data
|
Natsuki Hosokawa, Kohei Arimoto, Ken Wakita
|
2020
|
View Paper |
Enhancing Visualization Applications Using Open Data Sources
|
Ponlakit Suwanworaboon, S. Lynden, Suppawong Tuarob
|
2020
|
View Paper |
Calliope: Automatic Visual Data Story Generation from a Spreadsheet
|
Danqing Shi, Xinyue Xu, F. Sun, Yang Shi, Nan Cao
|
2020
|
View Paper |
A Structured Review of Data Management Technology for Interactive Visualization and Analysis
|
L. Battle, C. Scheidegger
|
2020
|
View Paper |
User Group Analytics Survey and Research Opportunities
|
Behrooz Omidvar-Tehrani, S. Amer-Yahia
|
2020
|
View Paper |
Quality Matters: Understanding the Impact of Incomplete Data on Visualization Recommendation
|
Rischan Mafrur, M. Sharaf, G. Zuccon
|
2020
|
View Paper |
Characterizing Automated Data Insights
|
Po-Ming Law, A. Endert, J. Stasko
|
2020
|
View Paper |
What are Data Insights to Professional Visualization Users?
|
Po-Ming Law, A. Endert, J. Stasko
|
2020
|
View Paper |
QuRVe: Query Refinement for View Recommendation in Visual Data Exploration
|
Humaira Ehsan, M. Sharaf, Gianluca Demartini
|
2020
|
View Paper |
Visual Analysis of Sorting and Classification of Multidimensional Data
|
Dongsheng Yang, Shidong Yu, Ying Hao
|
2020
|
View Paper |
Large-scale Data Exploration Using Explanatory Regression Functions
|
Fotis Savva, C. Anagnostopoulos, P. Triantafillou, Kostas Kolomvatsos
|
2020
|
View Paper |
AutoCaption: An Approach to Generate Natural Language Description from Visualization Automatically
|
Can Liu, Liwenhan Xie, Yun Han, Datong Wei, Xiaoru Yuan
|
2020
|
View Paper |
Amplifying Domain Expertise in Clinical Data Pipelines
|
Protiva Rahman, Arnab Nandi, C. Hebert
|
2020
|
View Paper |
DataShot: Automatic Generation of Fact Sheets from Tabular Data
|
Yun Wang, Zhida Sun, Haidong Zhang, Weiwei Cui, Ke Xu, Xiaojuan Ma, Dongmei Zhang
|
2020
|
View Paper |
Words of Estimative Correlation: Studying Verbalizations of Scatterplots
|
R. Henkin, C. Turkay
|
2019
|
View Paper |
Evaluating interactive data systems
|
Protiva Rahman, Lilong Jiang, Arnab Nandi
|
2019
|
View Paper |
Immersive Insights: A Hybrid Analytics System forCollaborative Exploratory Data Analysis
|
M. Cavallo, M. Dholakia, Matous Havlena, Kenneth Ocheltree, Mark Podlaseck
|
2019
|
View Paper |
TeleGam: Combining Visualization and Verbalization for Interpretable Machine Learning
|
Fred Hohman, Arjun Srinivasan, S. Drucker
|
2019
|
View Paper |
ProcessExplorer: Intelligent Process Mining Guidance
|
Alexander Seeliger, Alejandro Sánchez Guinea, Timo Nolle, M. Mühlhäuser
|
2019
|
View Paper |
Text-to-Viz: Automatic Generation of Infographics from Proportion-Related Natural Language Statements
|
Weiwei Cui, Xiaoyu Zhang, Yun Wang, He Huang, B. Chen, Lei Fang, Haidong Zhang, Jian-Guang Lou, Dongmei Zhang
|
2019
|
View Paper |
Hillview: A trillion-cell spreadsheet for big data
|
M. Budiu, Parikshit Gopalan, L. Suresh, Udi Wieder, Han Kruiger, M. Aguilera
|
2019
|
View Paper |
INDIANA: An interactive system for assisting database exploration
|
Antonio Giuzio, G. Mecca, E. Quintarelli, M. Roveri, Donatello Santoro, L. Tanca
|
2019
|
View Paper |
QuickInsights: Quick and Automatic Discovery of Insights from Multi-Dimensional Data
|
Rui Ding, Shi Han, Yong Xu, Haidong Zhang, Dongmei Zhang
|
2019
|
View Paper |
Data Pipelines for User Group Analytics
|
Behrooz Omidvar-Tehrani, S. Amer-Yahia
|
2019
|
View Paper |
Augmenting Visualizations with Interactive Data Facts to Facilitate Interpretation and Communication
|
Arjun Srinivasan, S. Drucker, A. Endert, J. Stasko
|
2019
|
View Paper |
A comprehensive review of tools for exploratory analysis of tabular industrial datasets
|
Aindrila Ghosh, Mona Nashaat, James Miller, Shaikh Quader, Chad Marston
|
2018
|
View Paper |
Duet: Helping Data Analysis Novices Conduct Pairwise Comparisons by Minimal Specification
|
Po-Ming Law, Rahul C. Basole, Yanhong Wu
|
2018
|
View Paper |
Explaining Aggregates for Exploratory Analytics
|
Fotis Savva, C. Anagnostopoulos, P. Triantafillou
|
2018
|
View Paper |
User Group Analytics: Discovery, Exploration and Visualization
|
Behrooz Omidvar-Tehrani, S. Amer-Yahia
|
2018
|
View Paper |
Data2Vis: Automatic Generation of Data Visualizations Using Sequence-to-Sequence Recurrent Neural Networks
|
Victor C. Dibia, Çağatay Demiralp
|
2018
|
View Paper |
Clustrophile 2: Guided Visual Clustering Analysis
|
M. Cavallo, Çağatay Demiralp
|
2018
|
View Paper |
Task-Based Effectiveness of Basic Visualizations
|
B. Saket, A. Endert, Çağatay Demiralp
|
2017
|
View Paper |
A Systematic Review of Visualization Recommendation Systems: Goals, Strategies, Interfaces, and Evaluations
|
Zehua Zeng, Leilani Battle
|
2024
|
View Paper |
VALS: Supporting Visual Data Analysis in Longitudinal Clinical Studies
|
Duván A. Gómez, N. Charpak, A. Montealegre, J. T. Hernández
|
2023
|
View Paper |
Efficient Diversification for Recommending Aggregate Data Visualizations
|
M. Sharaf, Rischan Mafrur, G. Zuccon
|
2023
|
View Paper |
Multi-Criteria Optimization for Automatic Dashboard Design
|
Ji-Won Choi, Jaemin Jo
|
2023
|
View Paper |
DPVis: Automatic Visual Encoding Based on Deep Learning
|
Jia Liu, Gang Wan, Panke Deng, Chu Li, Shuai Wang, Yunxia Yin, Lei Liu, Yao Mu
|
2023
|
View Paper |
Are We There Yet? A Systematic Review of Visual Perception Knowledge for Visualization Recommendation Systems
|
Zehua Zeng, L. Battle
|
2022
|
View Paper |
A Programmatic Definition of Visualization Tasks, Insights, and Objectives
|
L. Battle, Alvitta Ottley
|
2022
|
View Paper |
Pyxis: A Programmatic Definition of Visualization Insights, Objectives, and Tasks
|
Alvitta Ottley
|
2022
|
View Paper |
Are We There Yet? A Review on Existing Perceptual Theory and Experiment Support for Visualization Recommendation Systems
|
Zehua Zeng, Minhui Xie, Matthew Gouzoulis, L. Battle
|
2021
|
View Paper |
Survey on Artificial Intelligence Approaches for Visualization Data
|
Aoyu Wu, Yun Wang, Xinhuan Shu, Dominik Moritz, Weiwei Cui, Haidong Zhang, Dongmei Zhang, Huamin Qu
|
2021
|
View Paper |
Efficient Query Refinement for View Recommendation in Visual Data Exploration
|
M. Sharaf, Humaira Ehsan
|
2021
|
View Paper |
Exploring the "Double-Edged Sword" Effect of Auto-Insight Recommendation in Exploratory Data Analysis
|
Quan Li, Huanbin Lin, C. Tang, Xiguang Wei, Zhenhui Peng, Xiaojuan Ma, Tianjian Chen
|
2021
|
View Paper |
Exploring Visualization Implementation Challenges Faced by D3 Users Online
|
L. Battle, Danni Feng, Kelli Webber
|
2021
|
View Paper |
An Empirical Study on the (Non-)Importance of Cleaning Categorical Duplicates before ML
|
2021
|
View Paper | |
Aunt Lily Can Say Her Visualizations: Directing Analysis, Design, and Storytelling in Natural Language (A Vision)
|
Zening Qu, F. Du, R. Rossi
|
2021
|
View Paper |
New Trends in Databases and Information Systems: ADBIS 2020 Short Papers, Lyon, France, August 25–27, 2020, Proceedings
|
M. Ivanović, B. Thalheim, B. Catania, K. Schewe, M. Kirikova, Petr Šaloun, A. Dahanayake, T. Cerquitelli, Elena Baralis, Pietro Michiardi
|
2020
|
View Paper |
ORBITS: Online Recovery of Missing Values in Multiple Time Series Streams
|
Mourad Khayati, Ines Arous, Zakhar Tymchenko, P. Cudré-Mauroux
|
2020
|
View Paper |
Towards a Customizable Framework for Evaluating Visualization Recommendations
|
Kelsey R. Fulton, Debjani Saha, Katherine Scola, L. Battle
|
2019
|
View Paper |
Online Learning of Visualization Preferences through Dueling Bandits for Enhancing Visualization Recommendations
|
Jan-Frederik Kassel, Michael Rohs
|
2019
|
View Paper |
Accuracy Time User Preference Accuracy Time User Preference Find Anomalies Scatterplot
|
B. Saket, A. Endert, Çağatay Demiralp
|
2018
|
View Paper |
Hongtao Wu, Chris Paxton, Xin Meng, Jikai Ye, Gregory Chirikjian
Published: 2022-07-28
Comments (0)