Summary
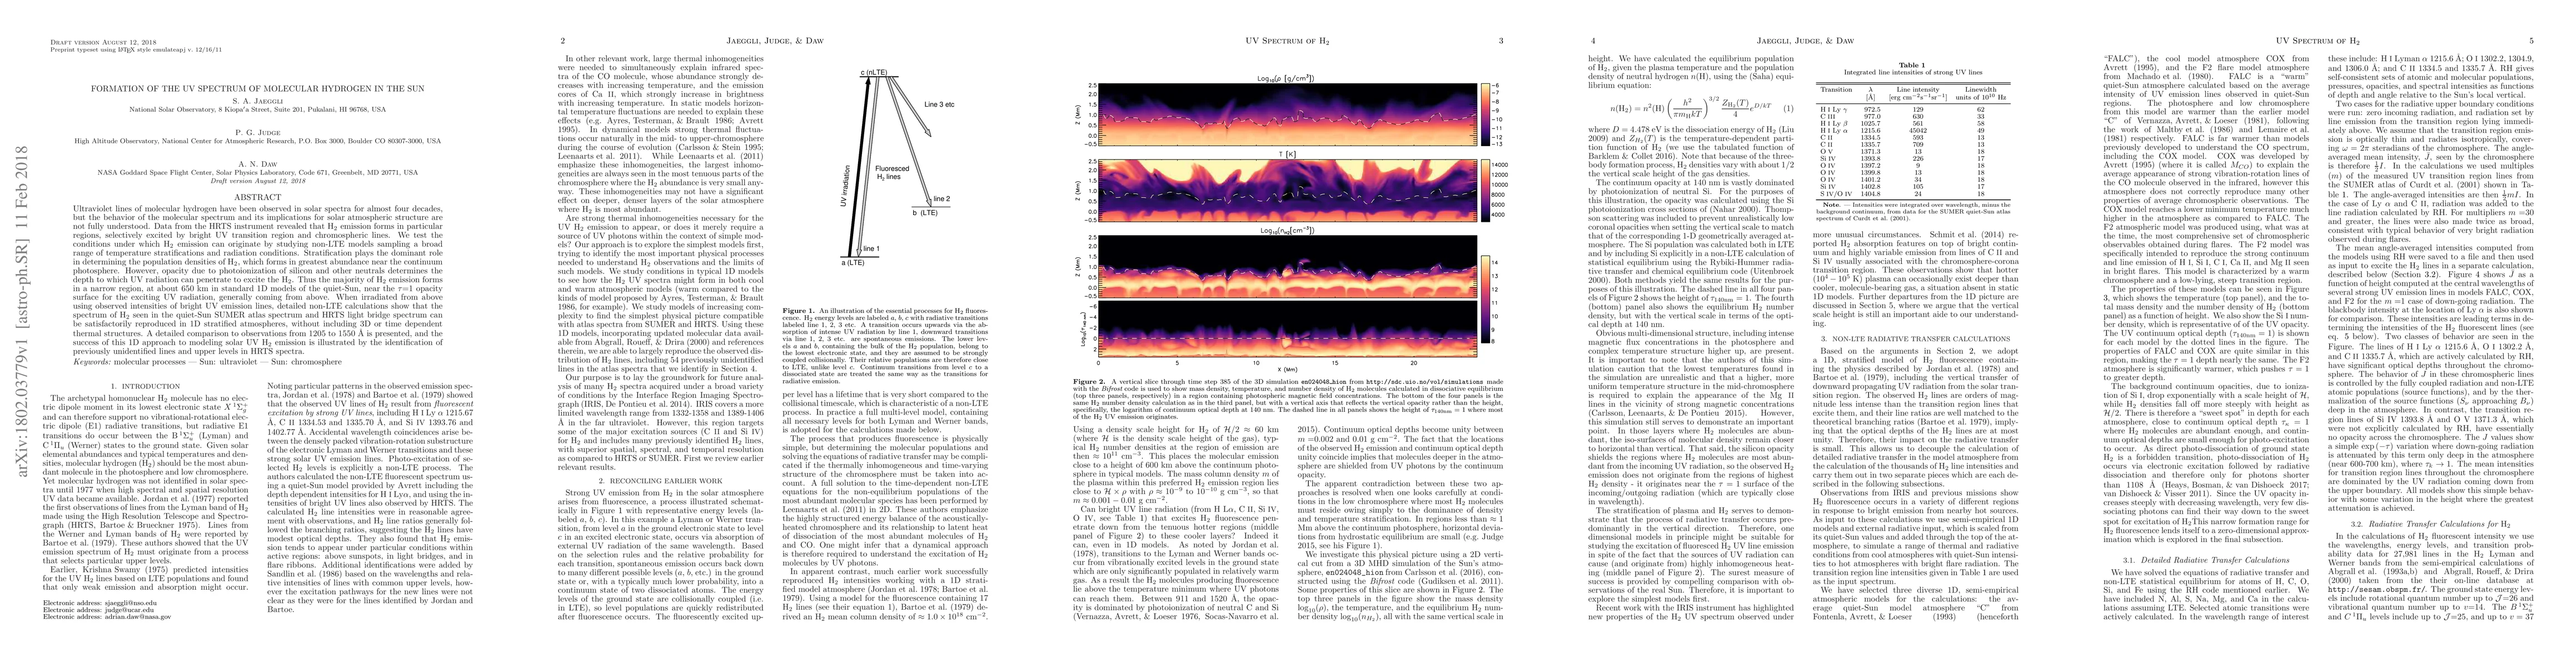
Ultraviolet lines of molecular hydrogen have been observed in solar spectra for almost four decades, but the behavior of the molecular spectrum and its implications for solar atmospheric structure are not fully understood. Data from the HRTS instrument revealed that H2 emission forms in particular regions, selectively excited by bright UV transition region and chromospheric lines. We test the conditions under which H2 emission can originate by studying non-LTE models sampling a broad range of temperature stratifications and radiation conditions. Stratification plays the dominant role in determining the population densities of H2, which forms in greatest abundance near the continuum photosphere. However, opacity due to photoionization of silicon and other neutrals determines the depth to which UV radiation can penetrate to excite the H2. Thus the majority of H2 emission forms in a narrow region, at about 650 km in standard 1D models of the quiet-Sun, near the tau=1 opacity surface for the exciting UV radiation, generally coming from above. When irradiated from above using observed intensities of bright UV emission lines, detailed non-LTE calculations show that the spectrum of H2 seen in the quiet-Sun SUMER atlas spectrum and HRTS light bridge spectrum can be satisfactorily reproduced in 1D stratified atmospheres, without including 3D or time dependent thermal structures. A detailed comparison to observations from 1205 to 1550 Angstroms is presented, and the success of this 1D approach to modeling solar UV H2 emission is illustrated by the identification of previously unidentified lines and upper levels in HRTS spectra.
AI Key Findings
Get AI-generated insights about this paper's methodology, results, and significance.
Paper Details
PDF Preview
Key Terms
Citation Network
Current paper (gray), citations (green), references (blue)
Display is limited for performance on very large graphs.
Similar Papers
Found 4 papers| Title | Authors | Year | Actions |
|---|
Comments (0)