Formulating the Proxy Pattern-Mixture Model as a Selection Model to Assist with Sensitivity Analysis
Publication
Metrics
AI Quick Summary
This paper reformulates the proxy pattern-mixture model (PPMM) as a selection model to clarify the assumptions underlying PPMM and the effect of the outcome on nonresponse. The selection model reveals that large values of the sensitivity parameter $\phi$ often lead to unrealistic selection mechanisms, providing a method to establish more realistic bounds for $\phi$ with an illustrative application using the U.S. Census Household Pulse Survey.
Paper Preview
Abstract
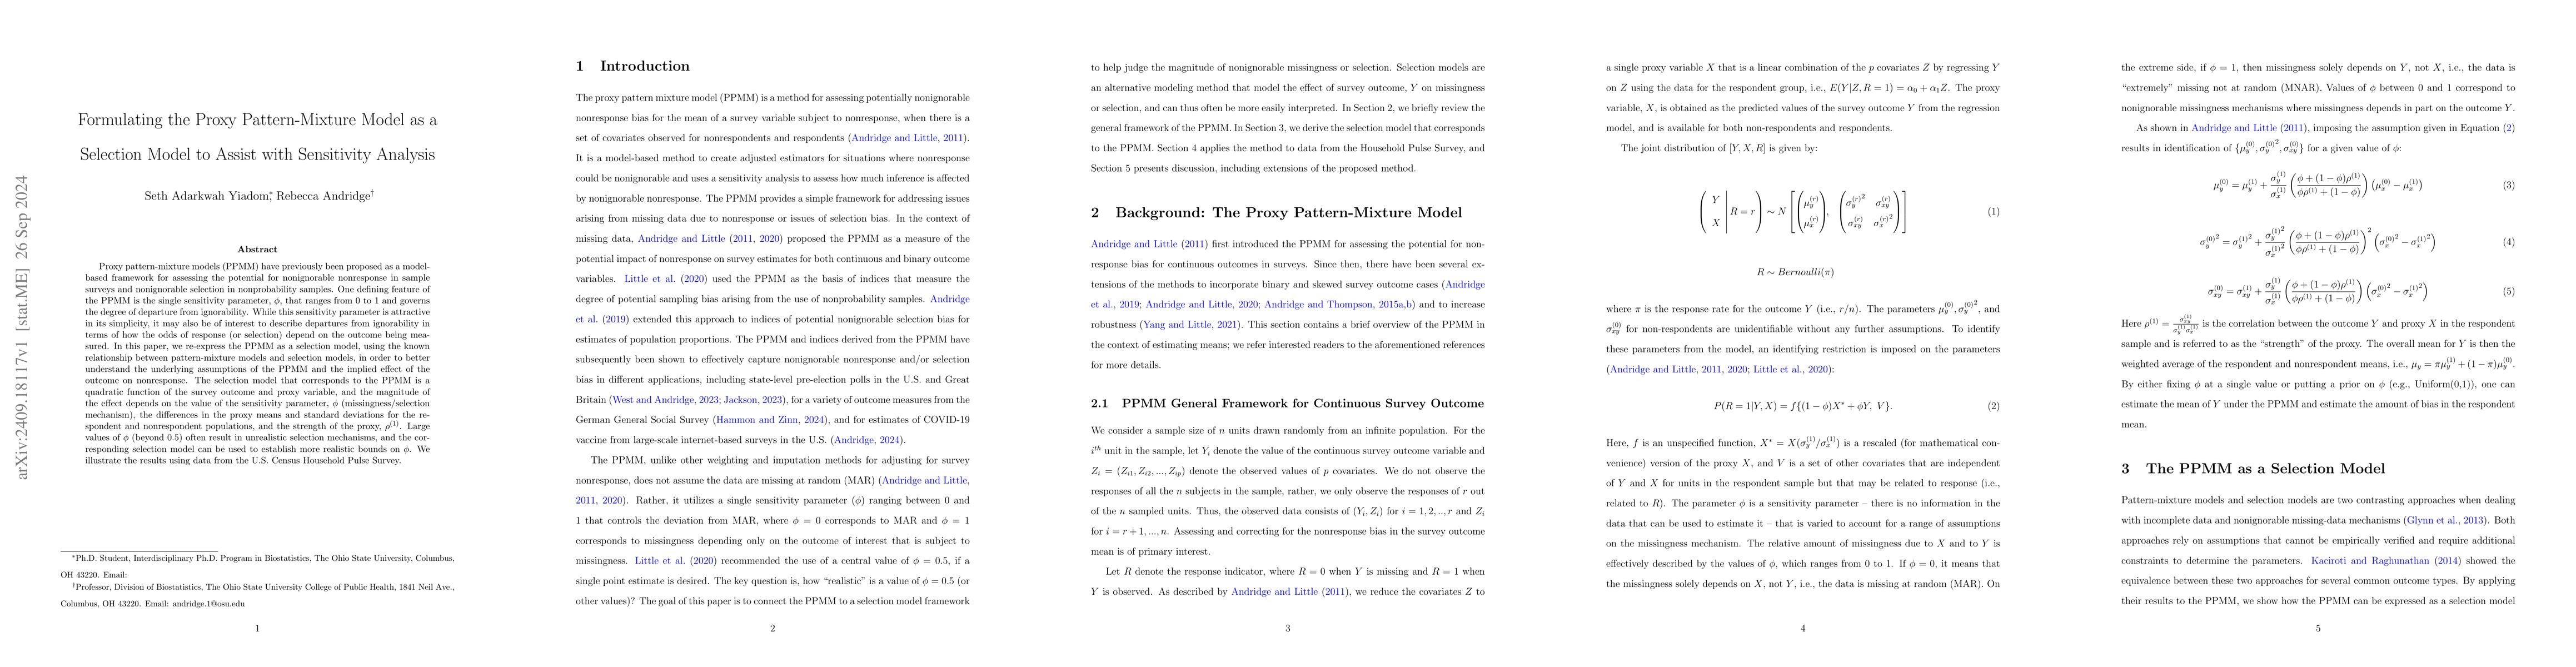
Proxy pattern-mixture models (PPMM) have previously been proposed as a model-based framework for assessing the potential for nonignorable nonresponse in sample surveys and nonignorable selection in nonprobability samples. One defining feature of the PPMM is the single sensitivity parameter, $\phi$, that ranges from 0 to 1 and governs the degree of departure from ignorability. While this sensitivity parameter is attractive in its simplicity, it may also be of interest to describe departures from ignorability in terms of how the odds of response (or selection) depend on the outcome being measured. In this paper, we re-express the PPMM as a selection model, using the known relationship between pattern-mixture models and selection models, in order to better understand the underlying assumptions of the PPMM and the implied effect of the outcome on nonresponse. The selection model that corresponds to the PPMM is a quadratic function of the survey outcome and proxy variable, and the magnitude of the effect depends on the value of the sensitivity parameter, $\phi$ (missingness/selection mechanism), the differences in the proxy means and standard deviations for the respondent and nonrespondent populations, and the strength of the proxy, $\rho^{(1)}$. Large values of $\phi$ (beyond $0.5$) often result in unrealistic selection mechanisms, and the corresponding selection model can be used to establish more realistic bounds on $\phi$. We illustrate the results using data from the U.S. Census Household Pulse Survey.
AI Key Findings
Get AI-generated insights about this paper's methodology, results, significance, and more — seven facets brought into focus.
Impact
Paper Details
Authors
PDF Preview
Citation Network
Current paper (gray), citations (green), references (blue)
Display is limited for performance on very large graphs.
Discussion 0