FreCT: Frequency-augmented Convolutional Transformer for Robust Time Series Anomaly Detection
Publication
Metrics
AI Quick Summary
The paper proposes FreCT, a Frequency-augmented Convolutional Transformer for robust time series anomaly detection, which integrates frequency information via Fourier transformation to capture both time-domain and frequency-domain dependencies, enhancing anomaly detection. Experiments show FreCT outperforms existing methods on multiple datasets.
Paper Preview
Abstract
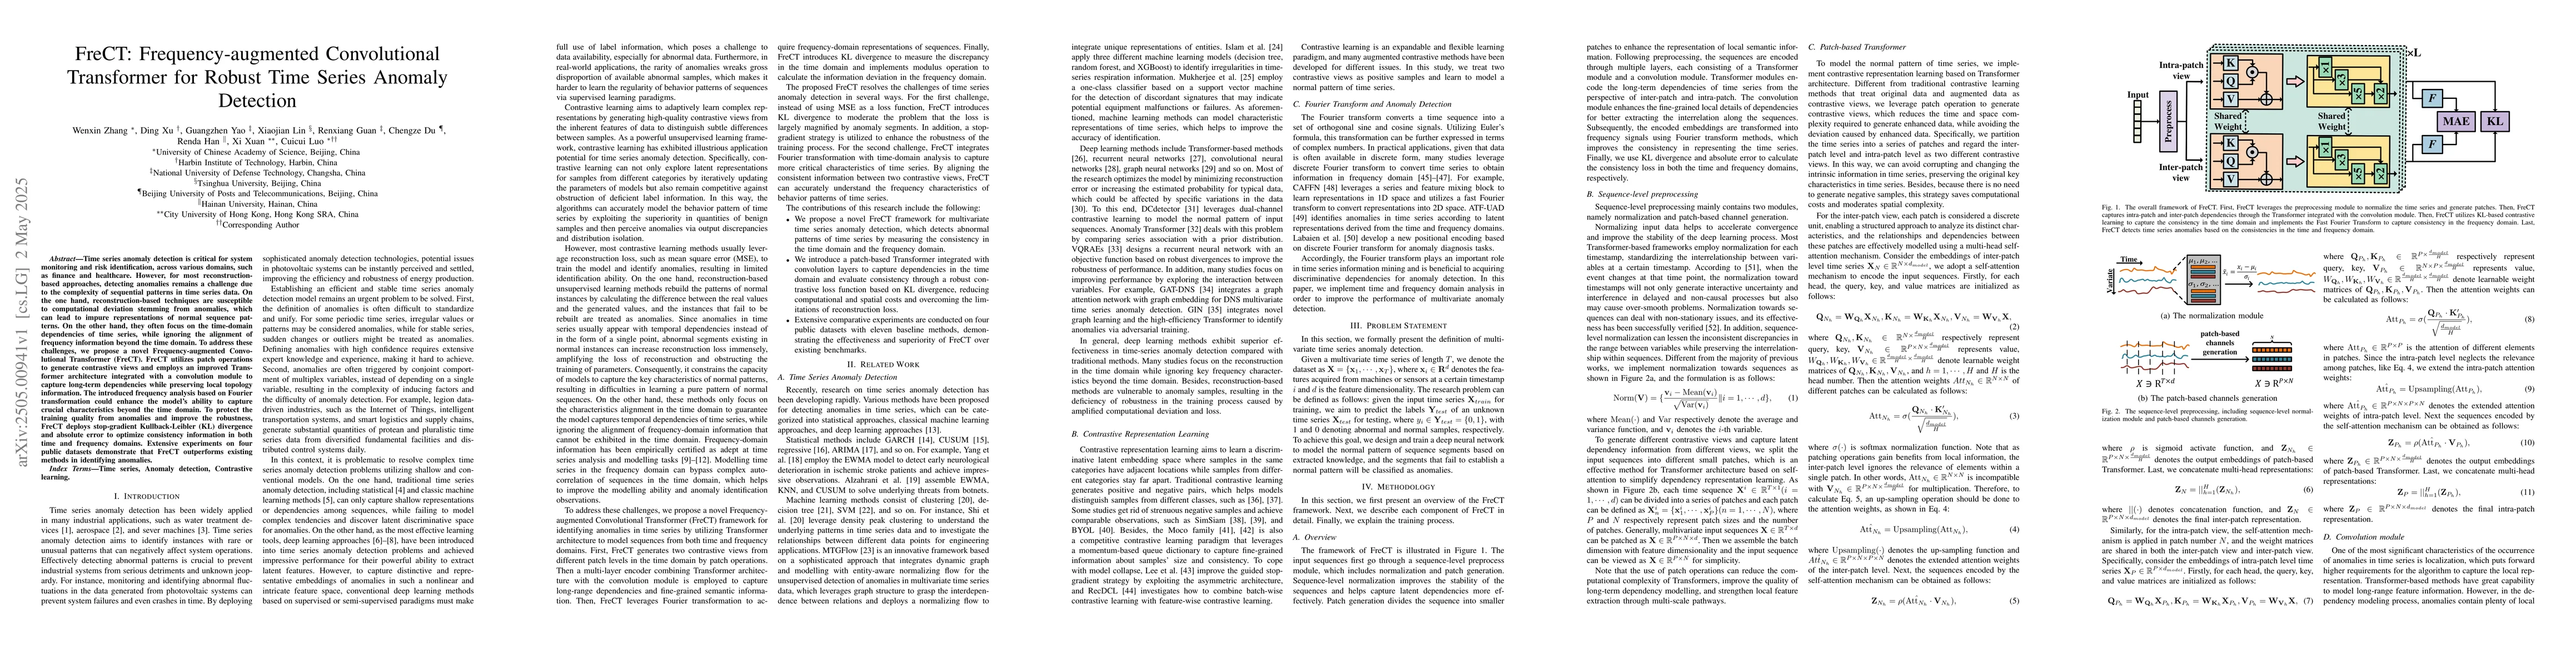
Time series anomaly detection is critical for system monitoring and risk identification, across various domains, such as finance and healthcare. However, for most reconstruction-based approaches, detecting anomalies remains a challenge due to the complexity of sequential patterns in time series data. On the one hand, reconstruction-based techniques are susceptible to computational deviation stemming from anomalies, which can lead to impure representations of normal sequence patterns. On the other hand, they often focus on the time-domain dependencies of time series, while ignoring the alignment of frequency information beyond the time domain. To address these challenges, we propose a novel Frequency-augmented Convolutional Transformer (FreCT). FreCT utilizes patch operations to generate contrastive views and employs an improved Transformer architecture integrated with a convolution module to capture long-term dependencies while preserving local topology information. The introduced frequency analysis based on Fourier transformation could enhance the model's ability to capture crucial characteristics beyond the time domain. To protect the training quality from anomalies and improve the robustness, FreCT deploys stop-gradient Kullback-Leibler (KL) divergence and absolute error to optimize consistency information in both time and frequency domains. Extensive experiments on four public datasets demonstrate that FreCT outperforms existing methods in identifying anomalies.
AI Key Findings
Get AI-generated insights about this paper's methodology, results, significance, and more — seven facets brought into focus.
Impact
Authors
PDF Preview
Citation Network
Current paper (gray), citations (green), references (blue)
Display is limited for performance on very large graphs.
Discussion 0