Frequency dependence of pulse width for 150 radio normal pulsars
Publication
Metrics
AI Quick Summary
This study examines the frequency dependence of pulse widths in 150 pulsars, categorizing them into three groups based on pulse width changes from 0.4 GHz to 4.85 GHz. Most pulsars (54%) show significant narrowing (group A), while 19% exhibit broadening (group C). The findings suggest that conventional models struggle to explain group C, proposing instead that diverse pulse width behaviors result from varying emission spectra across the emission region in a broadband fan beam emission model.
Paper Preview
Abstract
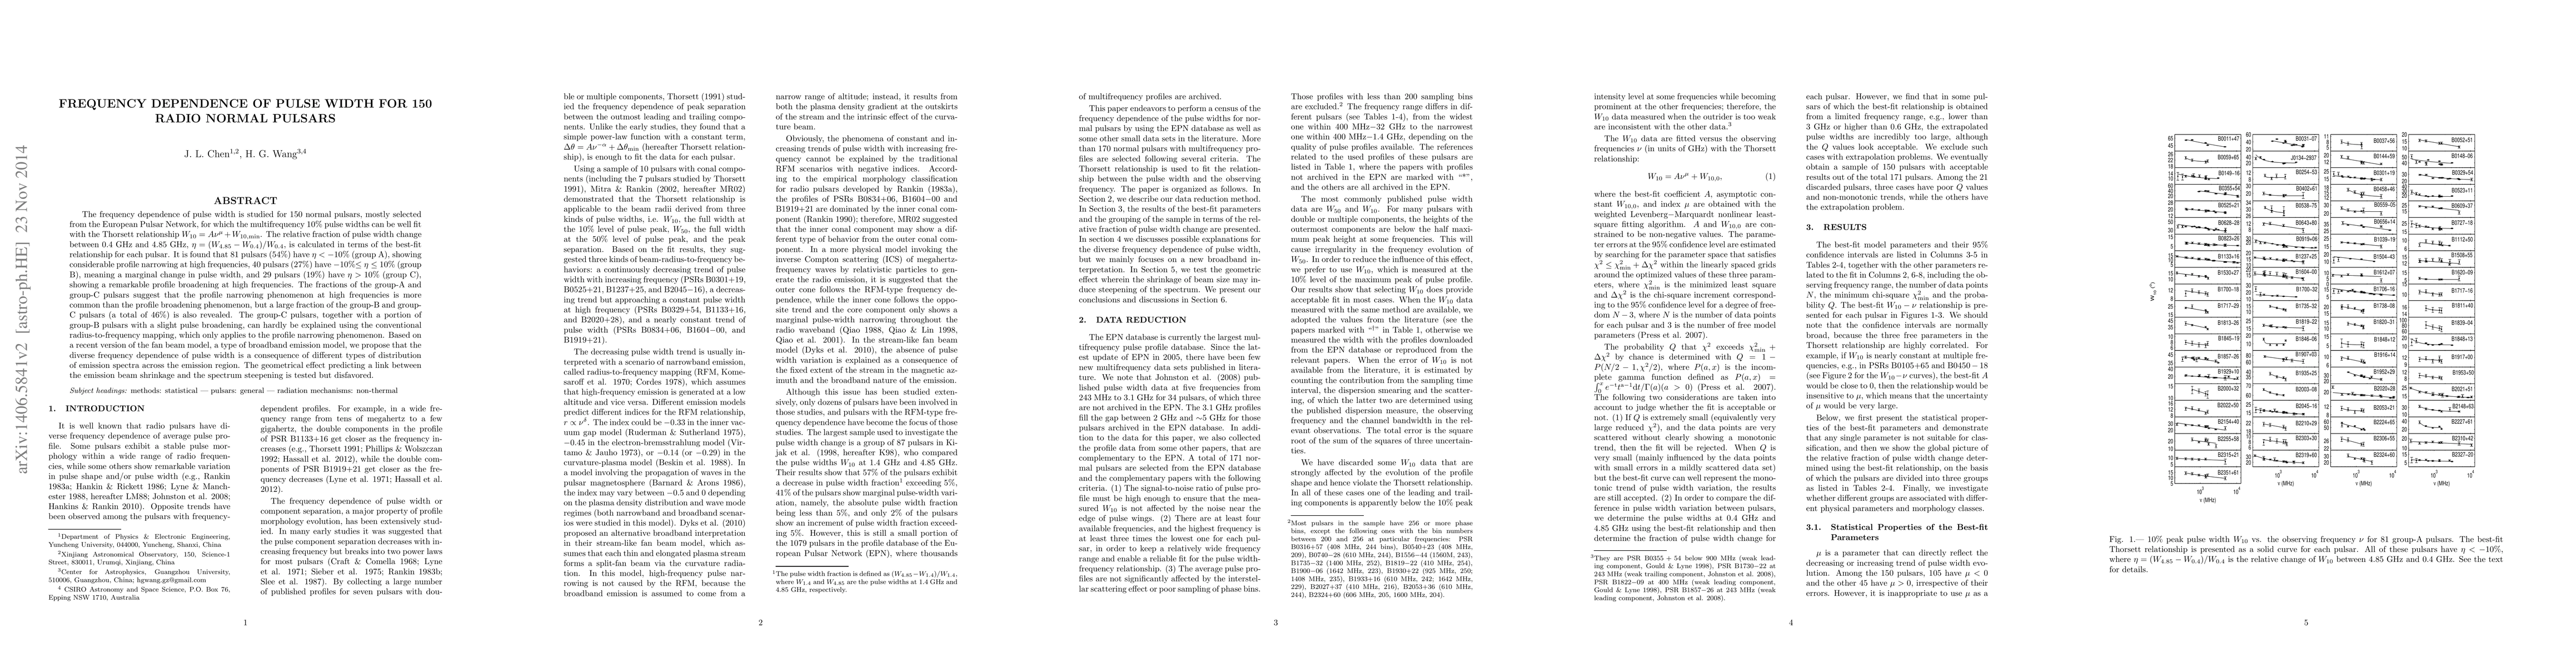
The frequency dependence of pulse width is studied for 150 normal pulsars, mostly selected from the European Pulsar Network, for which the 10\% multifrequency pulse widths can be well fit with the Thorsett relationship W_{10}=A\nu^{\mu}+W_{\rm 10, min}. The relative fraction of pulse width change between 0.4~GHz and 4.85~GHz, \eta=(W_{4.85}-W_{0.4})/W_{0.4}, is calculated in terms of the best-fit relationship for each pulsar. It is found that 81 pulsars (54\%) have $\eta<-10$\% (group A), showing considerable profile narrowing at high frequencies, 40 pulsars (27\%) have $-$10\%$\leq\eta\leq 10$\% (group B), meaning a marginal change in pulse width, and 29 pulsars (19\%) have $\eta>10$\% (group C), showing a remarkable profile broadening at high frequencies. The fractions of the group-A and group-C pulsars suggest that the profile narrowing phenomenon at high frequencies is more common than the profile broadening phenomenon, but a large fraction of the group-B and group-C pulsars (a total of 46\%) is also revealed. The group-C pulsars, together with a portion of group-B pulsars with a slight pulse broadening, can hardly be explained using the conventional radius-to-frequency mapping, which only applies to the profile narrowing phenomenon. Based on a recent version of the fan beam model, a type of broadband emission model, we propose that the diverse frequency dependence of pulse width is a consequence of different types of distribution of emission spectra across the emission region. The geometrical effect predicting a link between the emission beam shrinkage and the spectrum steepening is tested but disfavored.
AI Key Findings
Get AI-generated insights about this paper's methodology, results, significance, and more — seven facets brought into focus.
Impact
Paper Details
PDF Preview
Key Terms
Citation Network
Current paper (gray), citations (green), references (blue)
Display is limited for performance on very large graphs.
Discussion 0