FRODO: A novel approach to micro-macro multilevel regression
Publication
Metrics
AI Quick Summary
Title: FRODO: A novel approach to micro-macro multilevel regression Summary: FRODO is an empirical Bayesian technique for micro-macro data, inferring group-specific densities for multilevel covariates as functional predictors in a generalized additive model, thus providing richer insights into within-group covariate distributions while demonstrating versatility across various simulated datasets.
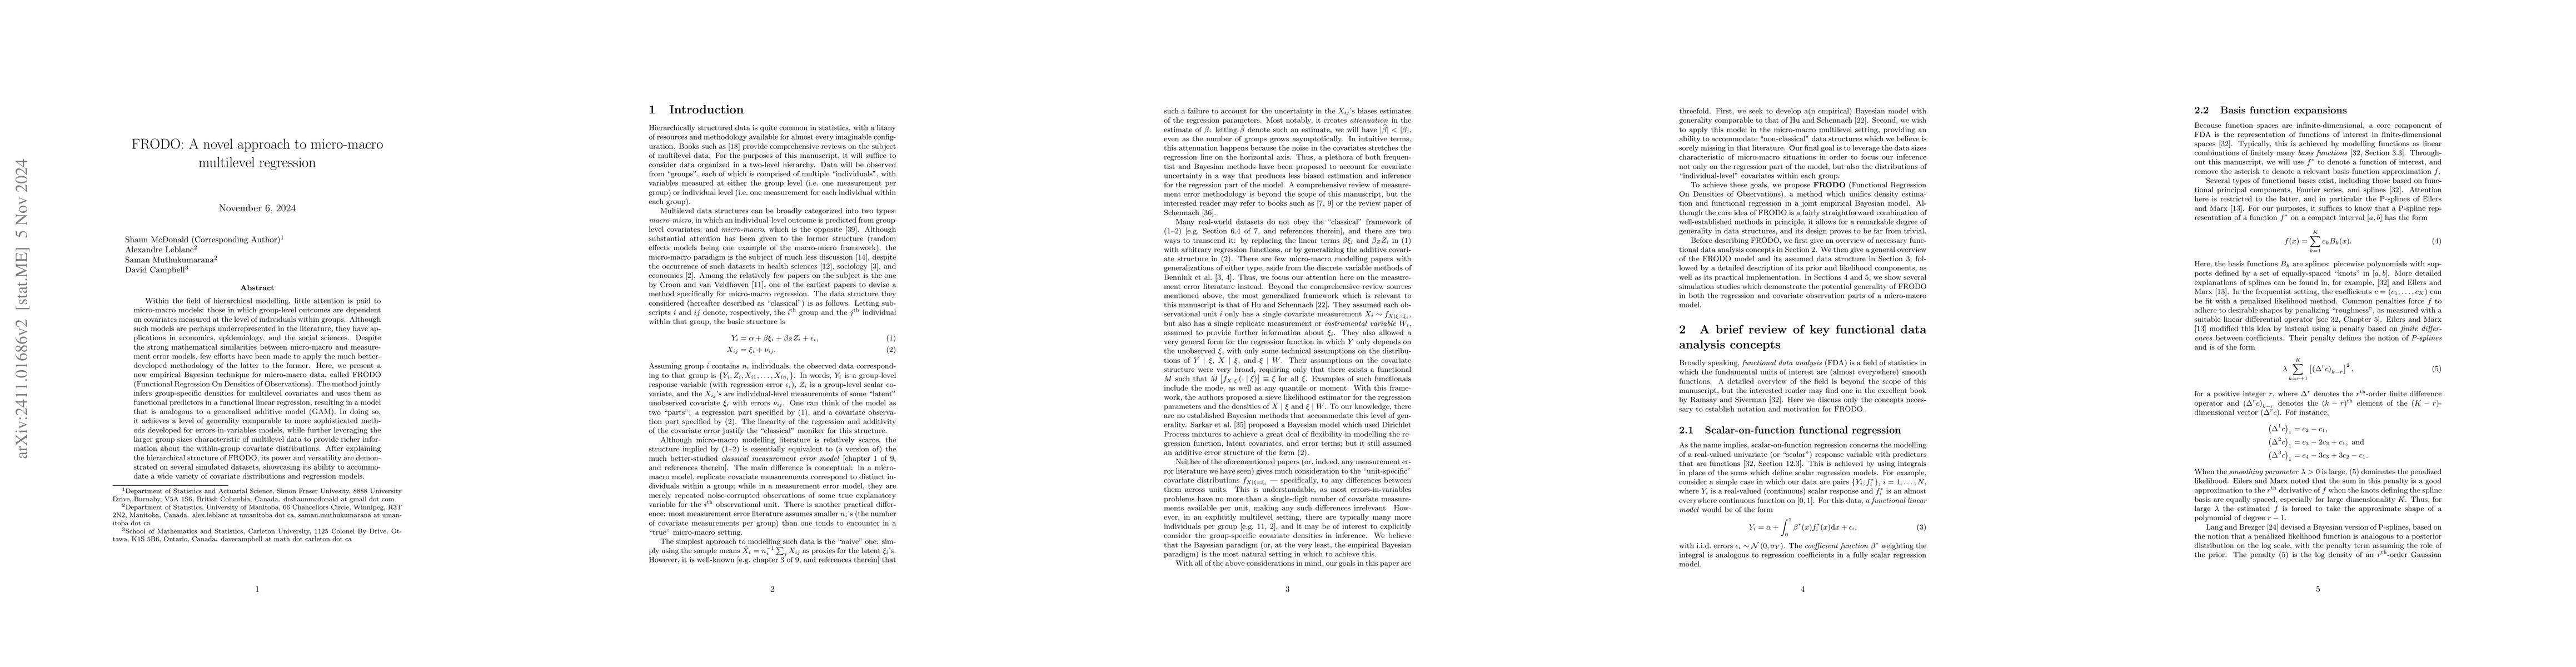
Paper Preview
Abstract
Within the field of hierarchical modelling, little attention is paid to micro-macro models: those in which group-level outcomes are dependent on covariates measured at the level of individuals within groups. Although such models are perhaps underrepresented in the literature, they have applications in economics, epidemiology, and the social sciences. Despite the strong mathematical similarities between micro-macro and measurement error models, few efforts have been made to apply the much better-developed methodology of the latter to the former. Here, we present a new empirical Bayesian technique for micro-macro data, called FRODO (Functional Regression On Densities of Observations). The method jointly infers group-specific densities for multilevel covariates and uses them as functional predictors in a functional linear regression, resulting in a model that is analogous to a generalized additive model (GAM). In doing so, it achieves a level of generality comparable to more sophisticated methods developed for errors-in-variables models, while further leveraging the larger group sizes characteristic of multilevel data to provide richer information about the within-group covariate distributions. After explaining the hierarchical structure of FRODO, its power and versatility are demonstrated on several simulated datasets, showcasing its ability to accommodate a wide variety of covariate distributions and regression models.
AI Key Findings
Get AI-generated insights about this paper's methodology, results, significance, and more — seven facets brought into focus.
Impact
Authors
PDF Preview
Citation Network
Current paper (gray), citations (green), references (blue)
Display is limited for performance on very large graphs.
Discussion 0