From Data to Probability Densities without Histograms
Publication
Metrics
AI Quick Summary
Researchers introduce a method to estimate probability densities from continuous data without using histograms, providing a smooth and parameter-free solution for visualizing statistical distributions.
Paper Preview
Abstract
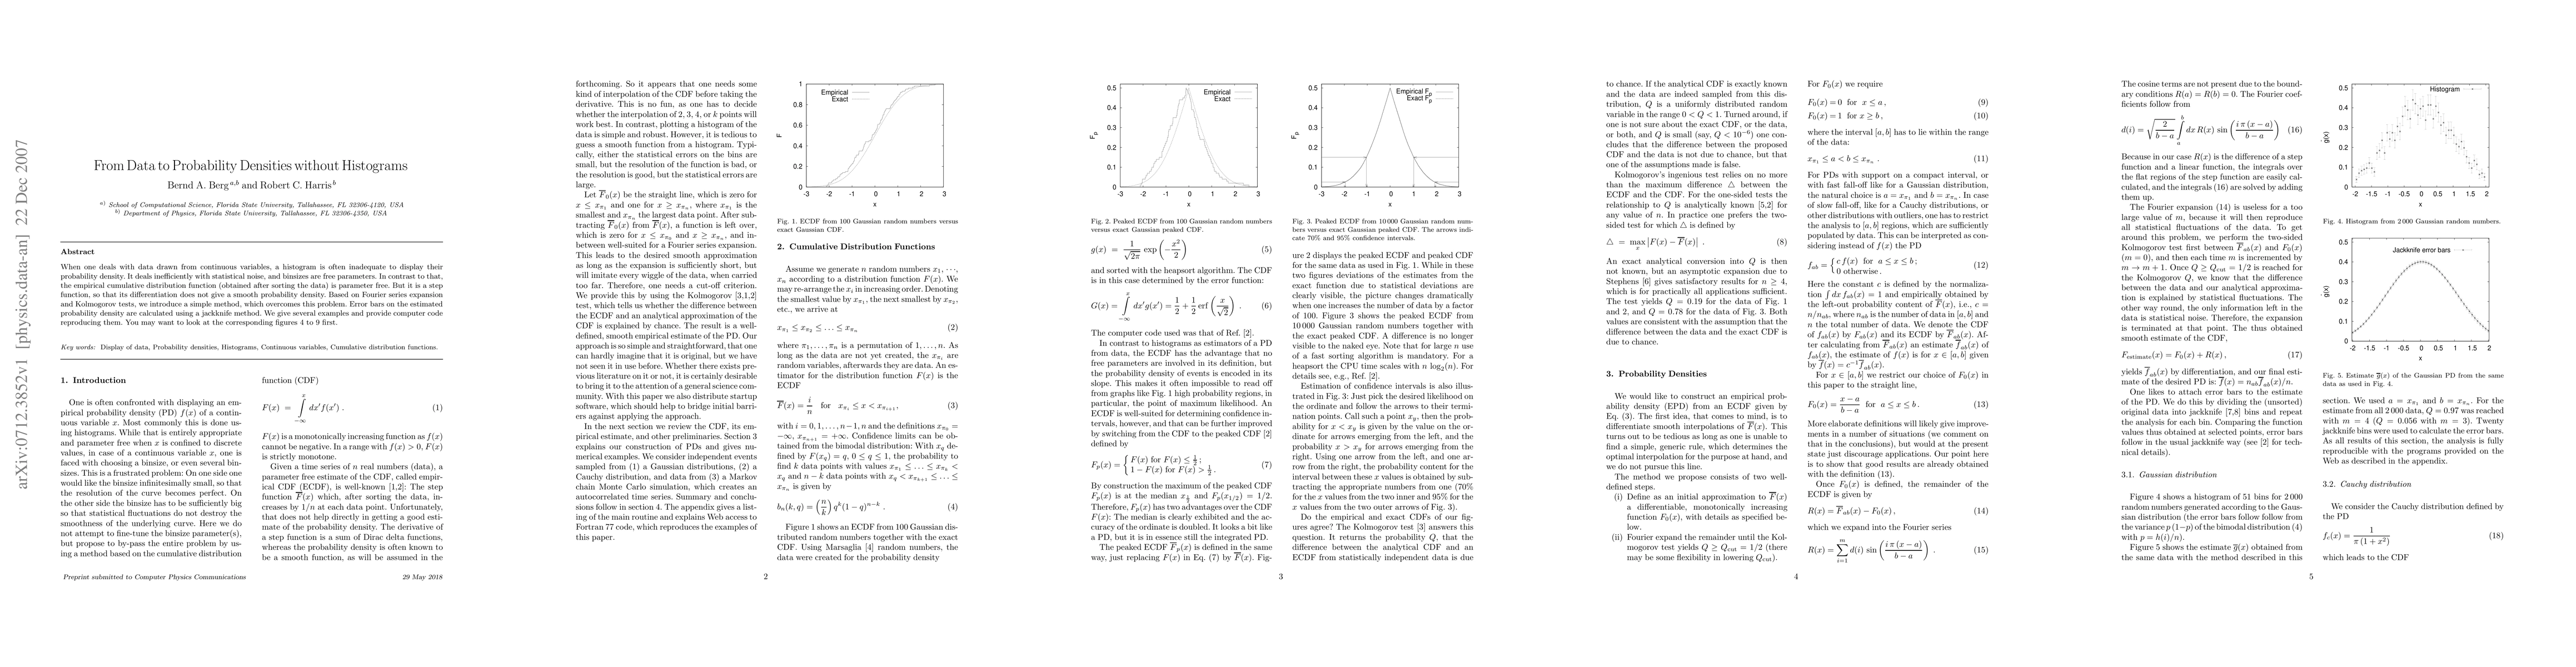
When one deals with data drawn from continuous variables, a histogram is often inadequate to display their probability density. It deals inefficiently with statistical noise, and binsizes are free parameters. In contrast to that, the empirical cumulative distribution function (obtained after sorting the data) is parameter free. But it is a step function, so that its differentiation does not give a smooth probability density. Based on Fourier series expansion and Kolmogorov tests, we introduce a simple method, which overcomes this problem. Error bars on the estimated probability density are calculated using a jackknife method. We give several examples and provide computer code reproducing them. You may want to look at the corresponding figures 4 to 9 first.
AI Key Findings
Get AI-generated insights about this paper's methodology, results, significance, and more — seven facets brought into focus.
Impact
Paper Details
PDF Preview
Key Terms
Citation Network
Current paper (gray), citations (green), references (blue)
Display is limited for performance on very large graphs.
Discussion 0