From Data to Visualisations and Back: Selecting Visualisations Based on Data and System Design Considerations
Publication
Metrics
AI Quick Summary
This paper discusses the process of selecting appropriate visualisations based on data characteristics and system design considerations for human-computer interaction (HCI) systems. It outlines a tutorial where participants learn to integrate data analytics with visualisation and interface design to enhance user experience.
Paper Preview
Abstract
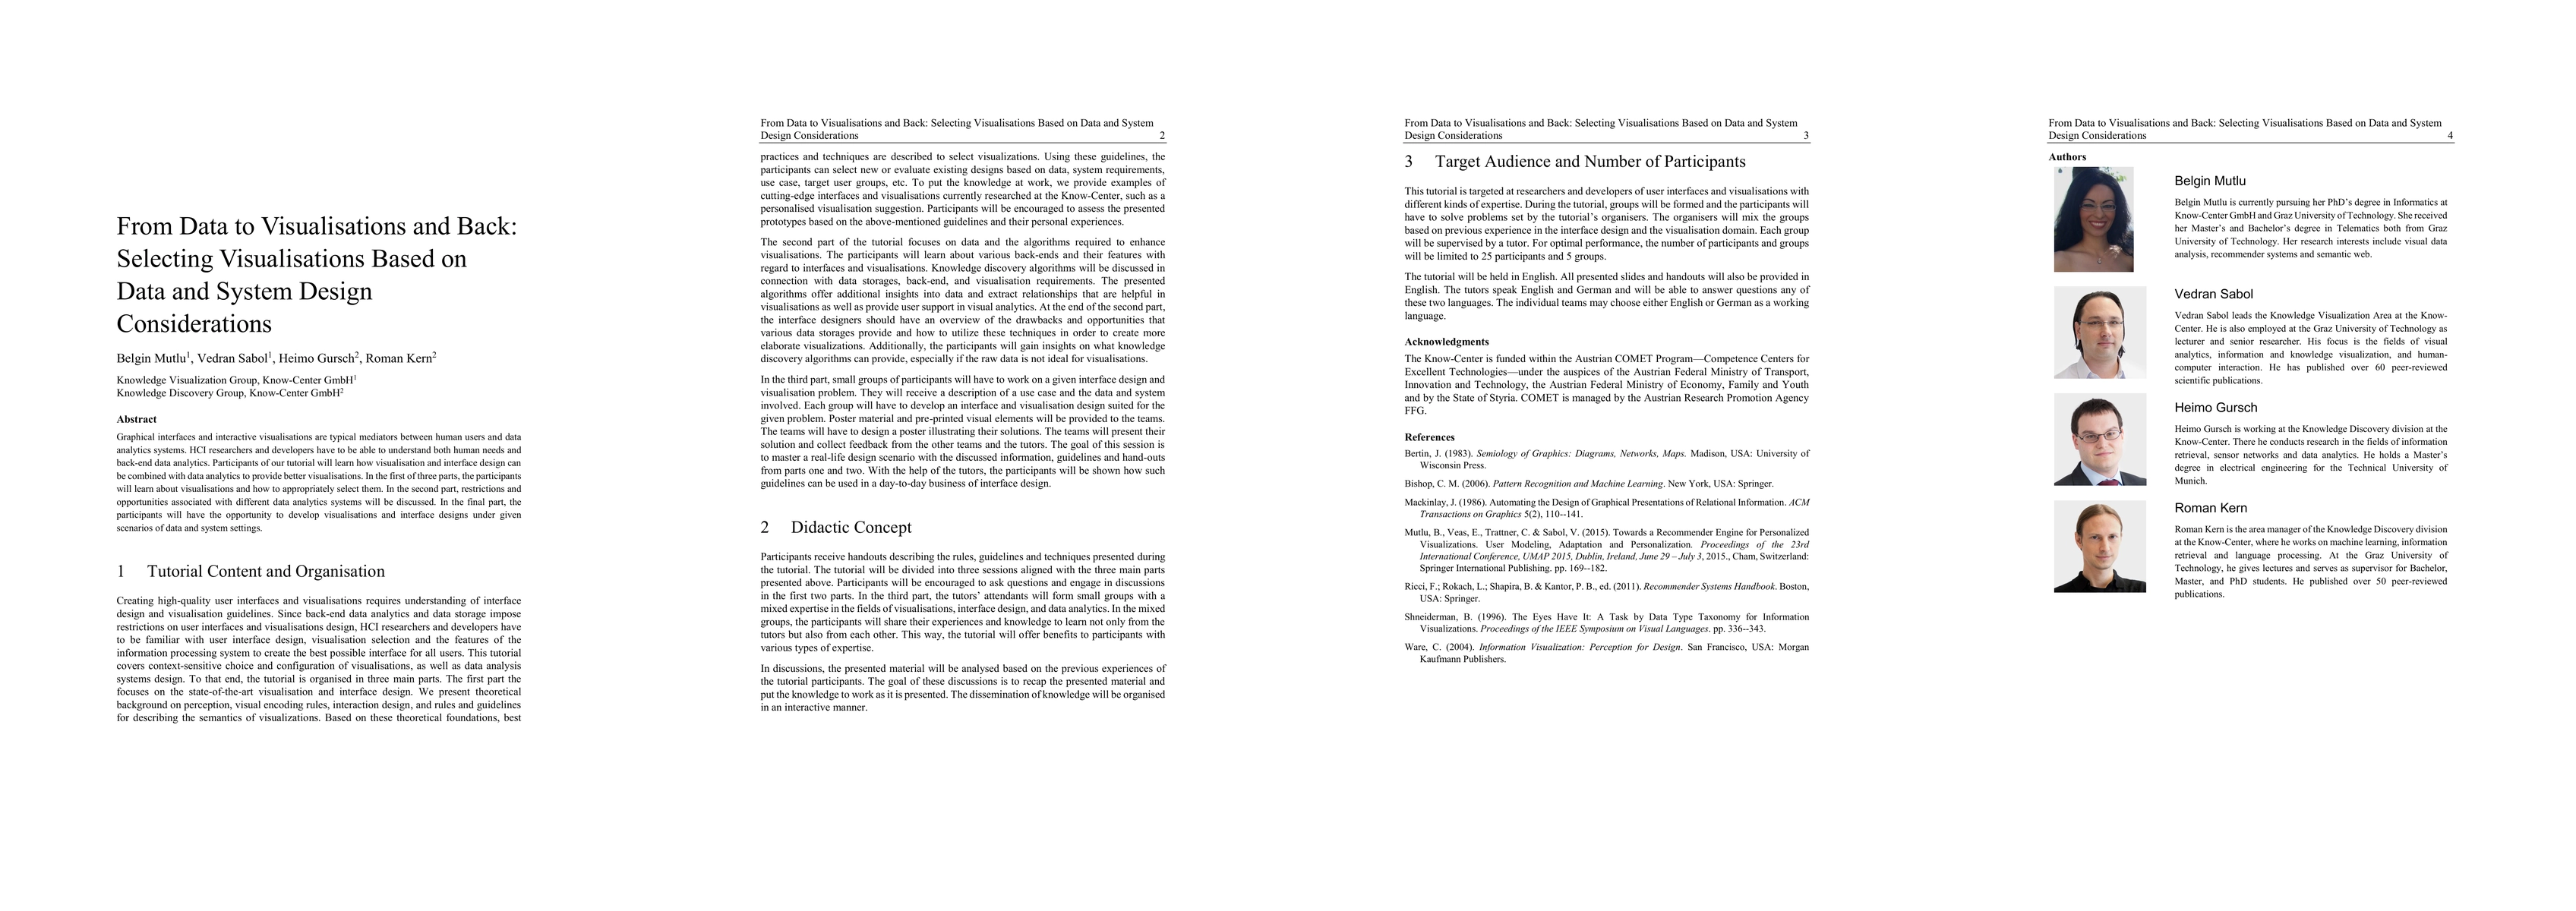
Graphical interfaces and interactive visualisations are typical mediators between human users and data analytics systems. HCI researchers and developers have to be able to understand both human needs and back-end data analytics. Participants of our tutorial will learn how visualisation and interface design can be combined with data analytics to provide better visualisations. In the first of three parts, the participants will learn about visualisations and how to appropriately select them. In the second part, restrictions and opportunities associated with different data analytics systems will be discussed. In the final part, the participants will have the opportunity to develop visualisations and interface designs under given scenarios of data and system settings.
AI Key Findings
Get AI-generated insights about this paper's methodology, results, significance, and more — seven facets brought into focus.
Impact
Paper Details
PDF Preview
Key Terms
Citation Network
Current paper (gray), citations (green), references (blue)
Display is limited for performance on very large graphs.
Discussion 0