Fully Three-dimensional Radial Visualization
Publication
Metrics
AI Quick Summary
This paper introduces RadViz3D, a methodology for three-dimensional radial visualization of multidimensional datasets, enhancing the classical 2D RadViz. The tool uses a 3D unit sphere for anchor points, providing better visualization with minimal visual correlations, and is implemented in the R package radviz3d.
Paper Preview
Abstract
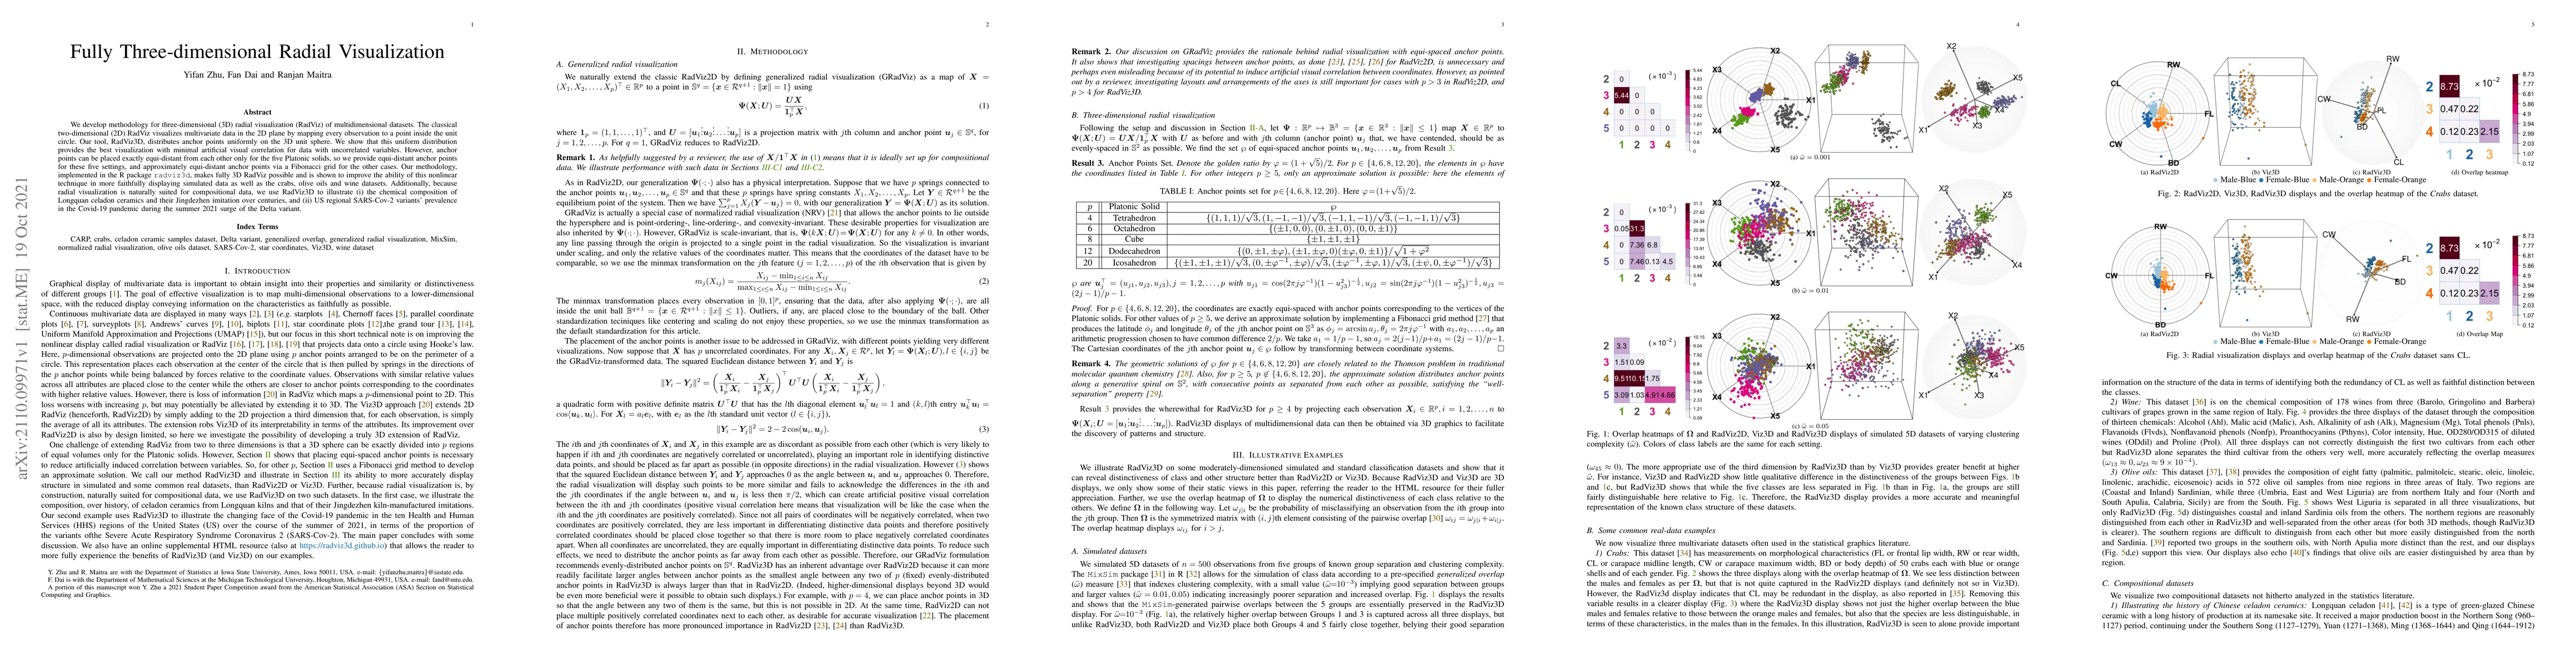
We develop methodology for three-dimensional (3D) radial visualization (RadViz) of multidimensional datasets. The classical two-dimensional (2D) RadViz visualizes multivariate data in the 2D plane by mapping every observation to a point inside the unit circle. Our tool, RadViz3D, distributes anchor points uniformly on the 3D unit sphere. We show that this uniform distribution provides the best visualization with minimal artificial visual correlation for data with uncorrelated variables. However, anchor points can be placed exactly equi-distant from each other only for the five Platonic solids, so we provide equi-distant anchor points for these five settings, and approximately equi-distant anchor points via a Fibonacci grid for the other cases. Our methodology, implemented in the R package $radviz3d$, makes fully 3D RadViz possible and is shown to improve the ability of this nonlinear technique in more faithfully displaying simulated data as well as the crabs, olive oils and wine datasets. Additionally, because radial visualization is naturally suited for compositional data, we use RadViz3D to illustrate (i) the chemical composition of Longquan celadon ceramics and their Jingdezhen imitation over centuries, and (ii) US regional SARS-Cov-2 variants' prevalence in the Covid-19 pandemic during the summer 2021 surge of the Delta variant.
AI Key Findings
Get AI-generated insights about this paper's methodology, results, significance, and more — seven facets brought into focus.
Impact
Paper Details
Authors
PDF Preview
Key Terms
Citation Network
Current paper (gray), citations (green), references (blue)
Display is limited for performance on very large graphs.
Discussion 0