Functional Connectivity of Imagined Speech and Visual Imagery based on Spectral Dynamics
Publication
Metrics
AI Quick Summary
This paper investigates the functional connectivity of imagined speech and visual imagery through spectral dynamics, revealing significant decreases in phase-locking value in specific brain regions during these tasks compared to resting state, which could enhance brain-computer interface communication.
Paper Preview
Abstract
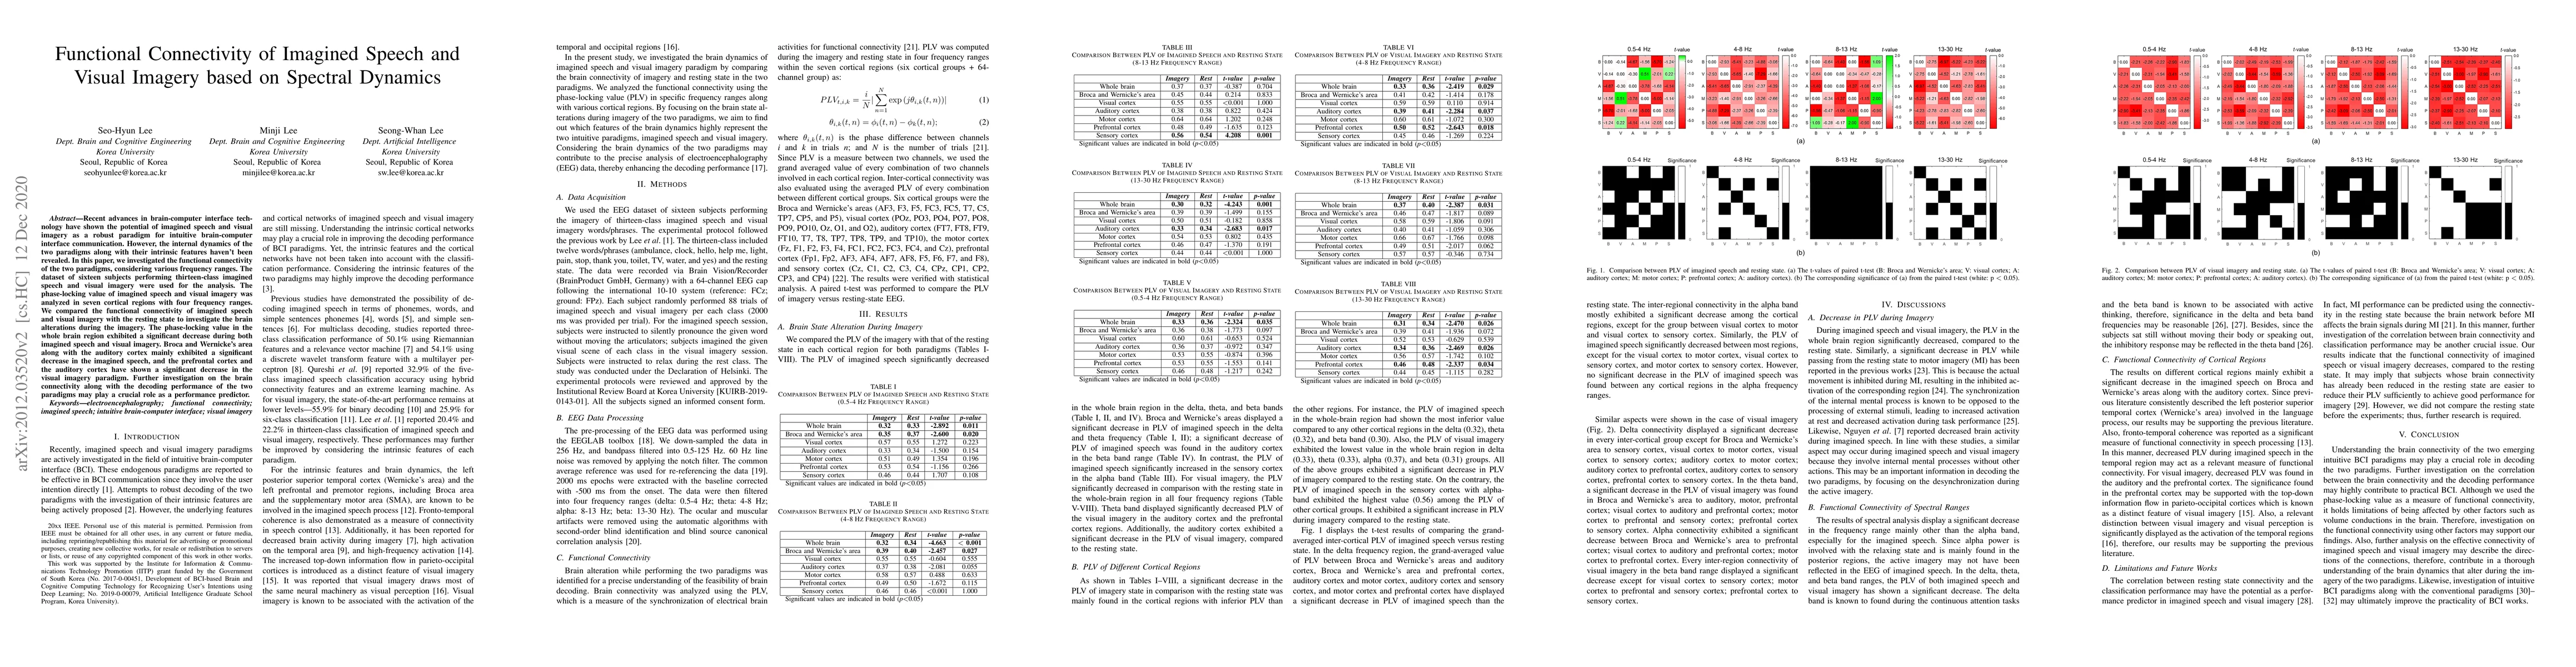
Recent advances in brain-computer interface technology have shown the potential of imagined speech and visual imagery as a robust paradigm for intuitive brain-computer interface communication. However, the internal dynamics of the two paradigms along with their intrinsic features haven't been revealed. In this paper, we investigated the functional connectivity of the two paradigms, considering various frequency ranges. The dataset of sixteen subjects performing thirteen-class imagined speech and visual imagery were used for the analysis. The phase-locking value of imagined speech and visual imagery was analyzed in seven cortical regions with four frequency ranges. We compared the functional connectivity of imagined speech and visual imagery with the resting state to investigate the brain alterations during the imagery. The phase-locking value in the whole brain region exhibited a significant decrease during both imagined speech and visual imagery. Broca and Wernicke's area along with the auditory cortex mainly exhibited a significant decrease in the imagined speech, and the prefrontal cortex and the auditory cortex have shown a significant decrease in the visual imagery paradigm. Further investigation on the brain connectivity along with the decoding performance of the two paradigms may play a crucial role as a performance predictor.
AI Key Findings
Get AI-generated insights about this paper's methodology, results, significance, and more — seven facets brought into focus.
Impact
Paper Details
PDF Preview
Key Terms
Citation Network
Current paper (gray), citations (green), references (blue)
Display is limited for performance on very large graphs.
Discussion 0