Functional Data Analysis of Amplitude and Phase Variation
Publication
Metrics
AI Quick Summary
This paper discusses the challenges of functional data analysis (FDA) when dealing with phase variation, which differs from amplitude variability and complicates the separation of phase and amplitude components. It reviews current methods for addressing phase variability, highlighting differences in their mathematical definitions, objective functions, and algorithmic tools.
Paper Preview
Abstract
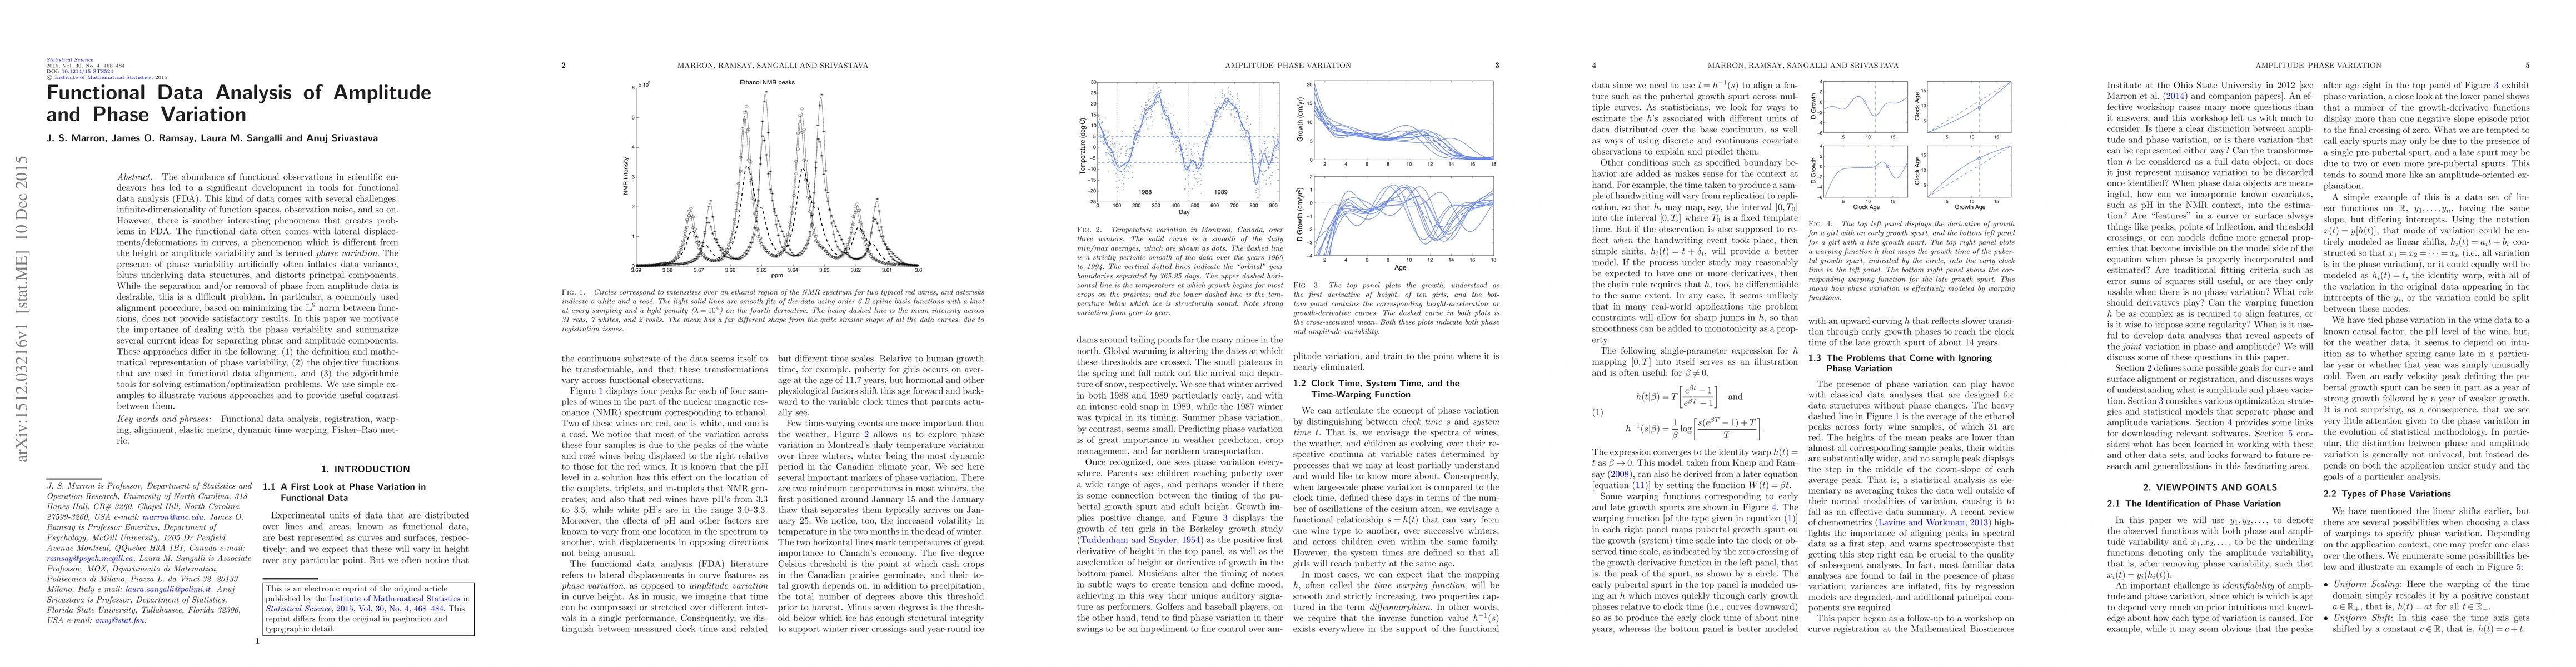
The abundance of functional observations in scientific endeavors has led to a significant development in tools for functional data analysis (FDA). This kind of data comes with several challenges: infinite-dimensionality of function spaces, observation noise, and so on. However, there is another interesting phenomena that creates problems in FDA. The functional data often comes with lateral displacements/deformations in curves, a phenomenon which is different from the height or amplitude variability and is termed phase variation. The presence of phase variability artificially often inflates data variance, blurs underlying data structures, and distorts principal components. While the separation and/or removal of phase from amplitude data is desirable, this is a difficult problem. In particular, a commonly used alignment procedure, based on minimizing the $\mathbb{L}^2$ norm between functions, does not provide satisfactory results. In this paper we motivate the importance of dealing with the phase variability and summarize several current ideas for separating phase and amplitude components. These approaches differ in the following: (1) the definition and mathematical representation of phase variability, (2) the objective functions that are used in functional data alignment, and (3) the algorithmic tools for solving estimation/optimization problems. We use simple examples to illustrate various approaches and to provide useful contrast between them.
AI Key Findings
Get AI-generated insights about this paper's methodology, results, significance, and more — seven facets brought into focus.
Impact
Paper Details
PDF Preview
Key Terms
Citation Network
Current paper (gray), citations (green), references (blue)
Display is limited for performance on very large graphs.
Discussion 0