Publication
Metrics
AI Quick Summary
This study analyzes the evolution of galaxy clustering over a wide redshift range using photometric redshifts in the Subaru Deep Field, finding that the two-point correlation function's slope and correlation length show minimal variation. The linear bias factor increases with redshift, indicating a steeper slope for luminous galaxies compared to fainter ones.
Paper Preview
Abstract
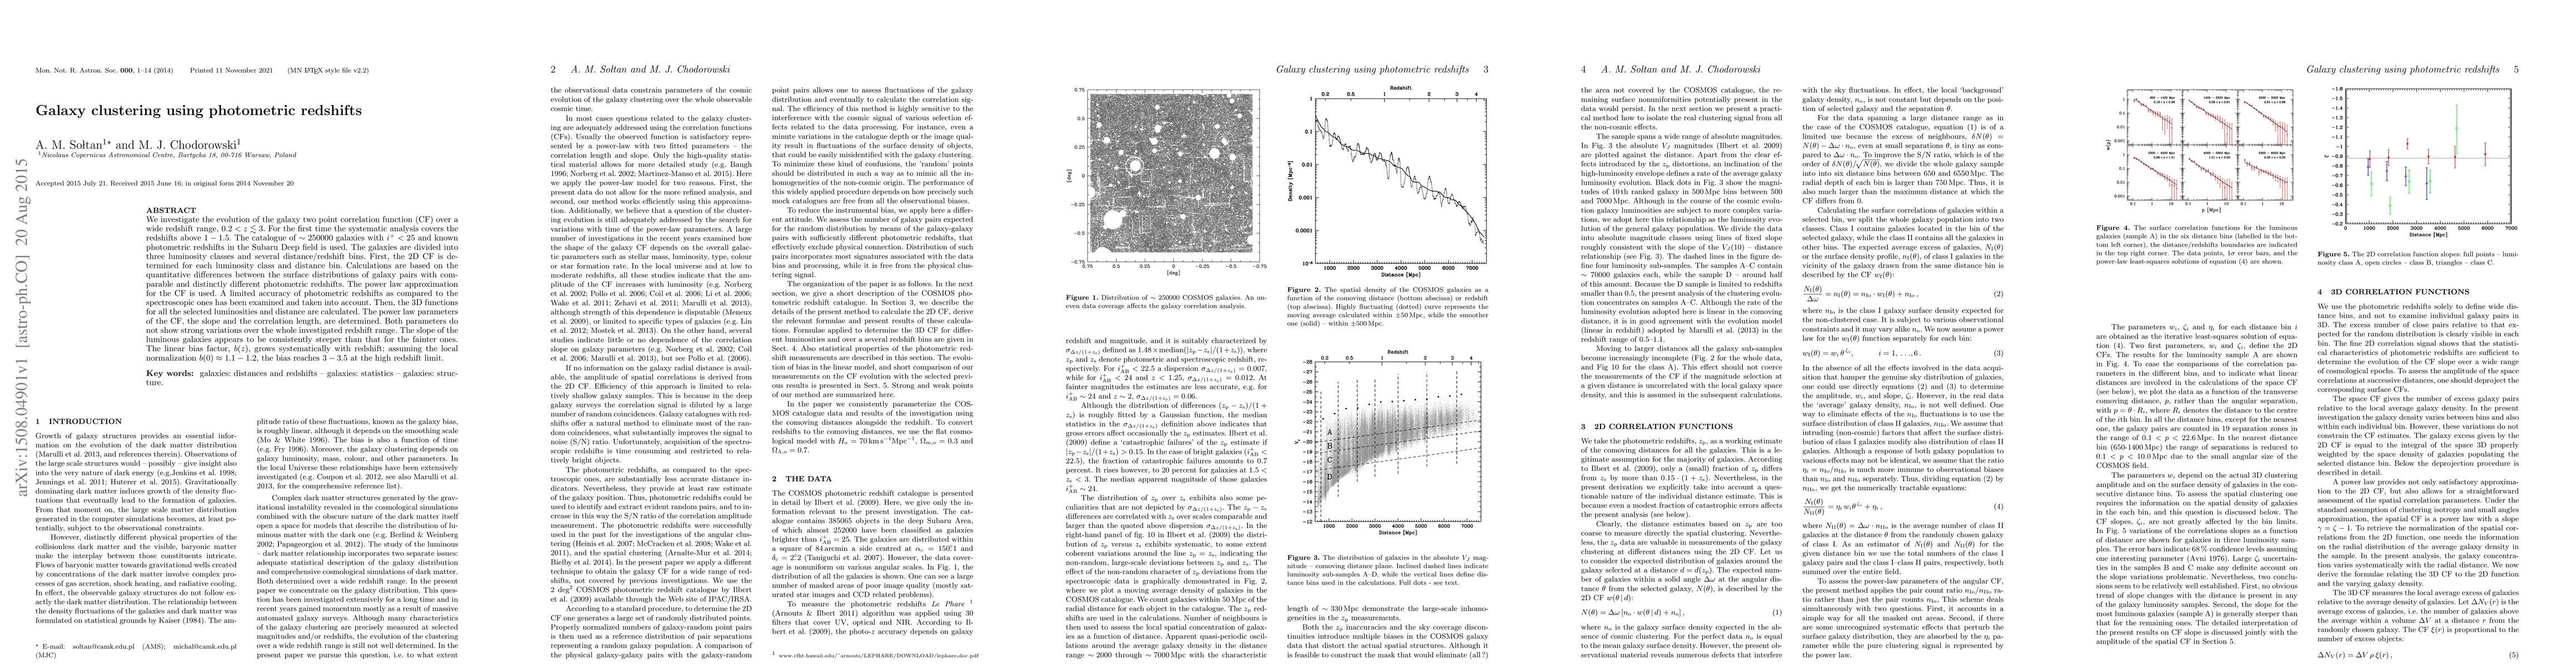
We investigate the evolution of the galaxy two point correlation function (CF) over a wide redshift range, 0.2 < z < 3. For the first time the systematic analysis covers the redshifts above 1 - 1.5. The catalogue of ~250000 galaxies with i+ < 25 and known photometric redshifts in the Subaru Deep field is used. The galaxies are divided into three luminosity classes and several distance/redshift bins. First, the 2D CF is determined for each luminosity class and distance bin. Calculations are based on the quantitative differences between the surface distributions of galaxy pairs with comparable and distinctly different photometric redshifts. The power law approximation for the CF is used. A limited accuracy of photometric redshifts as compared to the spectroscopic ones has been examined and taken into account. Then, the 3D functions for all the selected luminosities and distances are calculated. The power-law parameters of the CF, the slope and the correlation length, are determined. Both parameters do not show strong variations over the whole investigated redshift range. The slope of the luminous galaxies appears to be consistently steeper than that for the fainter ones. The linear bias factor, b(z), grows systematically with redshift; assuming the local normalization b(0) = 1.1-1.2, the bias reaches 3 - 3.5 at the high redshift limit.
AI Key Findings
Get AI-generated insights about this paper's methodology, results, significance, and more — seven facets brought into focus.
Impact
Paper Details
PDF Preview
Key Terms
Citation Network
Current paper (gray), citations (green), references (blue)
Display is limited for performance on very large graphs.
Discussion 0