Galaxy-dark matter connection from weak lensing in imaging surveys: Impact of photometric redshift errors
Publication
Metrics
AI Quick Summary
This research examines the impact of photometric redshift errors on galaxy-dark matter connection inferred from weak lensing in imaging surveys. It finds that systematic biases in inferred halo masses are minor for low-mass galaxies but increase significantly for more massive galaxies, reaching up to 0.2 dex.
Paper Preview
Abstract
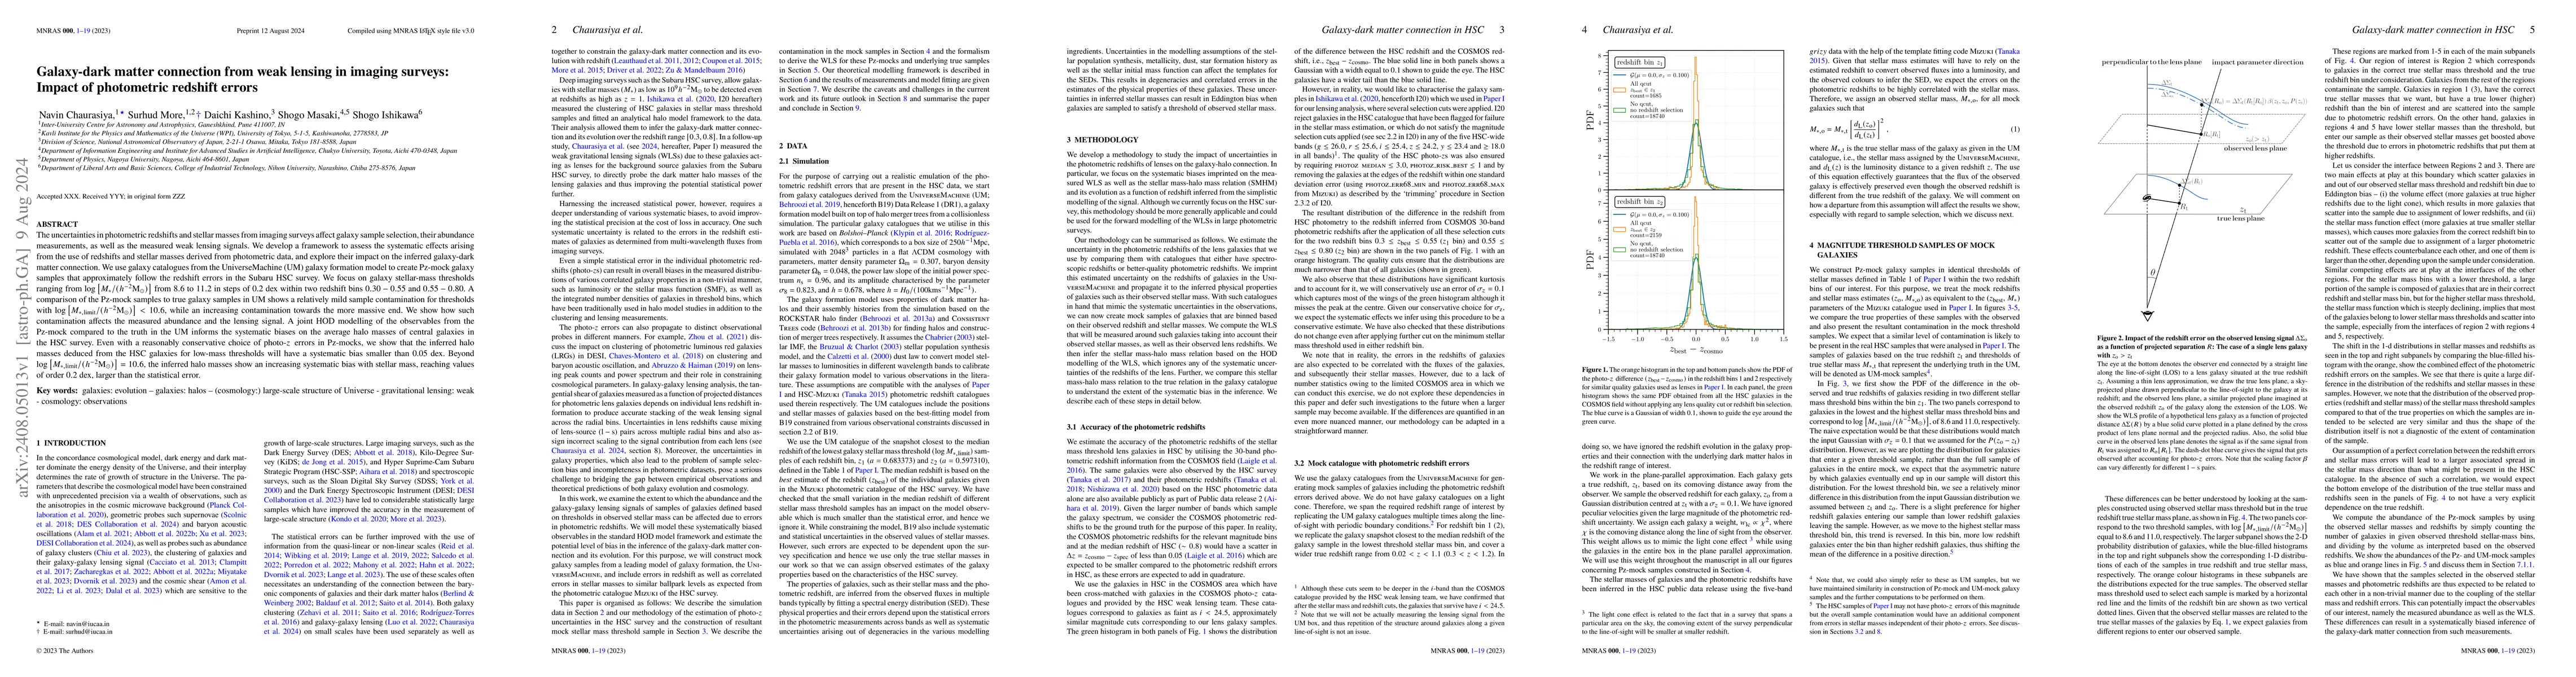
The uncertainties in photometric redshifts and stellar masses from imaging surveys affect galaxy sample selection, their abundance measurements, as well as the measured weak lensing signals. We develop a framework to assess the systematic effects arising from the use of redshifts and stellar masses derived from photometric data, and explore their impact on the inferred galaxy-dark matter connection. We use galaxy catalogues from the UniverseMachine (UM) galaxy formation model to create Pz-mock galaxy samples that approximately follow the redshift errors in the Subaru HSC survey. We focus on galaxy stellar-mass thresholds ranging from $\log\left[M_*/(h^{-2}M_\odot)\right]$ from $8.6$ to $11.2$ in steps of 0.2 dex within two redshift bins $0.30-0.55$ and $0.55-0.80$. A comparison of the Pz-mock samples to true galaxy samples in UM shows a relatively mild sample contamination for thresholds with $\log\left[M_{*,\rm limit}/(h^{-2}M_\odot)\right]<10.6$, while an increasing contamination towards the more massive end. We show how such contamination affects the measured abundance and the lensing signal. A joint HOD modelling of the observables from the Pz-mock compared to the truth in the UM informs the systematic biases on the average halo masses of central galaxies in the HSC survey. Even with a reasonably conservative choice of photo-$z$ errors in Pz-mock, we show that the inferred halo masses deduced from the HSC galaxies for low-mass thresholds will have a systematic bias smaller than 0.05 dex. Beyond $\log\left[M_{*,\rm limit}/(h^{-2}M_\odot)\right]=10.6$, the inferred halo masses show an increasing systematic bias with stellar mass, reaching values of order $0.2$ dex, larger than the statistical error.
AI Key Findings
Get AI-generated insights about this paper's methodology, results, significance, and more — seven facets brought into focus.
Impact
Paper Details
Authors
PDF Preview
Citation Network
Current paper (gray), citations (green), references (blue)
Display is limited for performance on very large graphs.
Discussion 0