Publication
Metrics
Paper Preview
Abstract
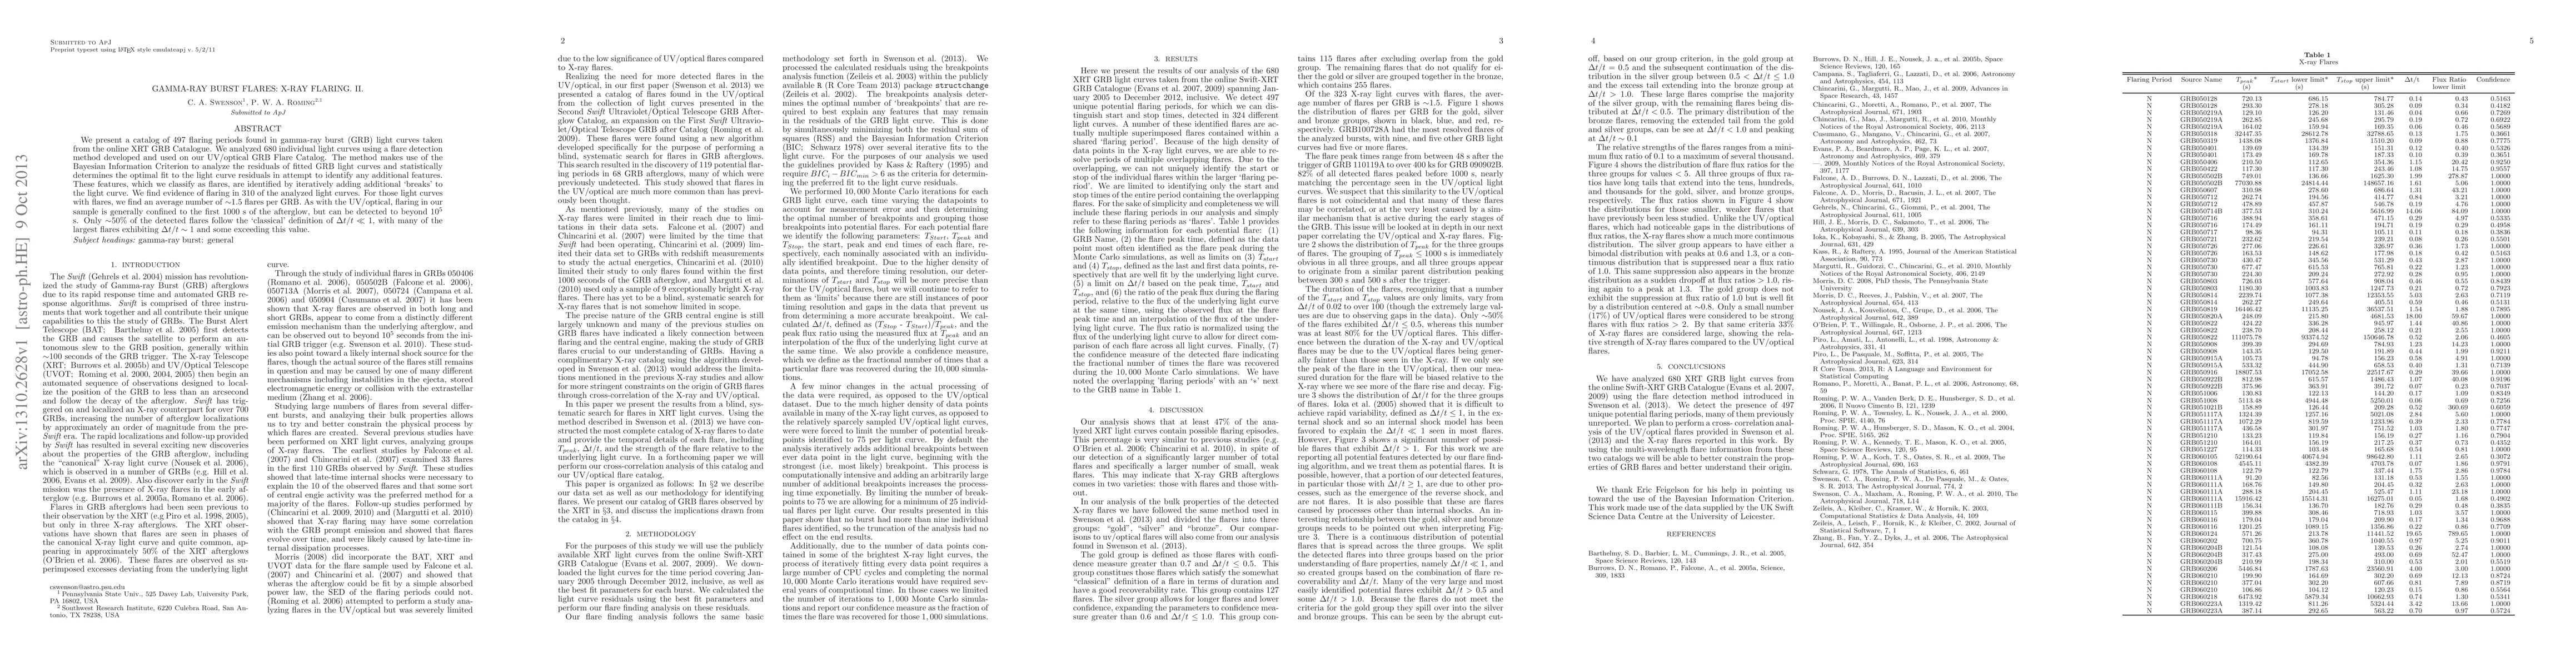
We present a catalog of 497 flaring periods found in gamma-ray burst (GRB) light curves taken from the online XRT GRB Catalogue. We analyzed 680 individual light curves using a flare detection method developed and used on our UV/optical GRB Flare Catalog. The method makes use of the Bayesian Information Criterion to analyze the residuals of fitted GRB light curves and statistically determines the optimal fit to the light curve residuals in attempt to identify any additional features. These features, which we classify as flares, are identified by iteratively adding additional `breaks' to the light curve. We find evidence of flaring in 310 of the analyzed light curves. For those light curves with flares, we find an average number of ~1.5 flares per GRB. As with the UV/optical, flaring in our sample is generally confined to the first 1000 s of the afterglow, but can be detected to beyond 10^5 s. Only ~50% of the detected flares follow the `classical' definition of \Delta t/t << 1, with many of the largest flares exhibiting \Delta t/t ~ 1 and some exceeding this value.
AI Key Findings
Get AI-generated insights about this paper's methodology, results, significance, and more — seven facets brought into focus.
Impact
Paper Details
PDF Preview
Key Terms
Citation Network
Current paper (gray), citations (green), references (blue)
Display is limited for performance on very large graphs.
Discussion 0