Summary
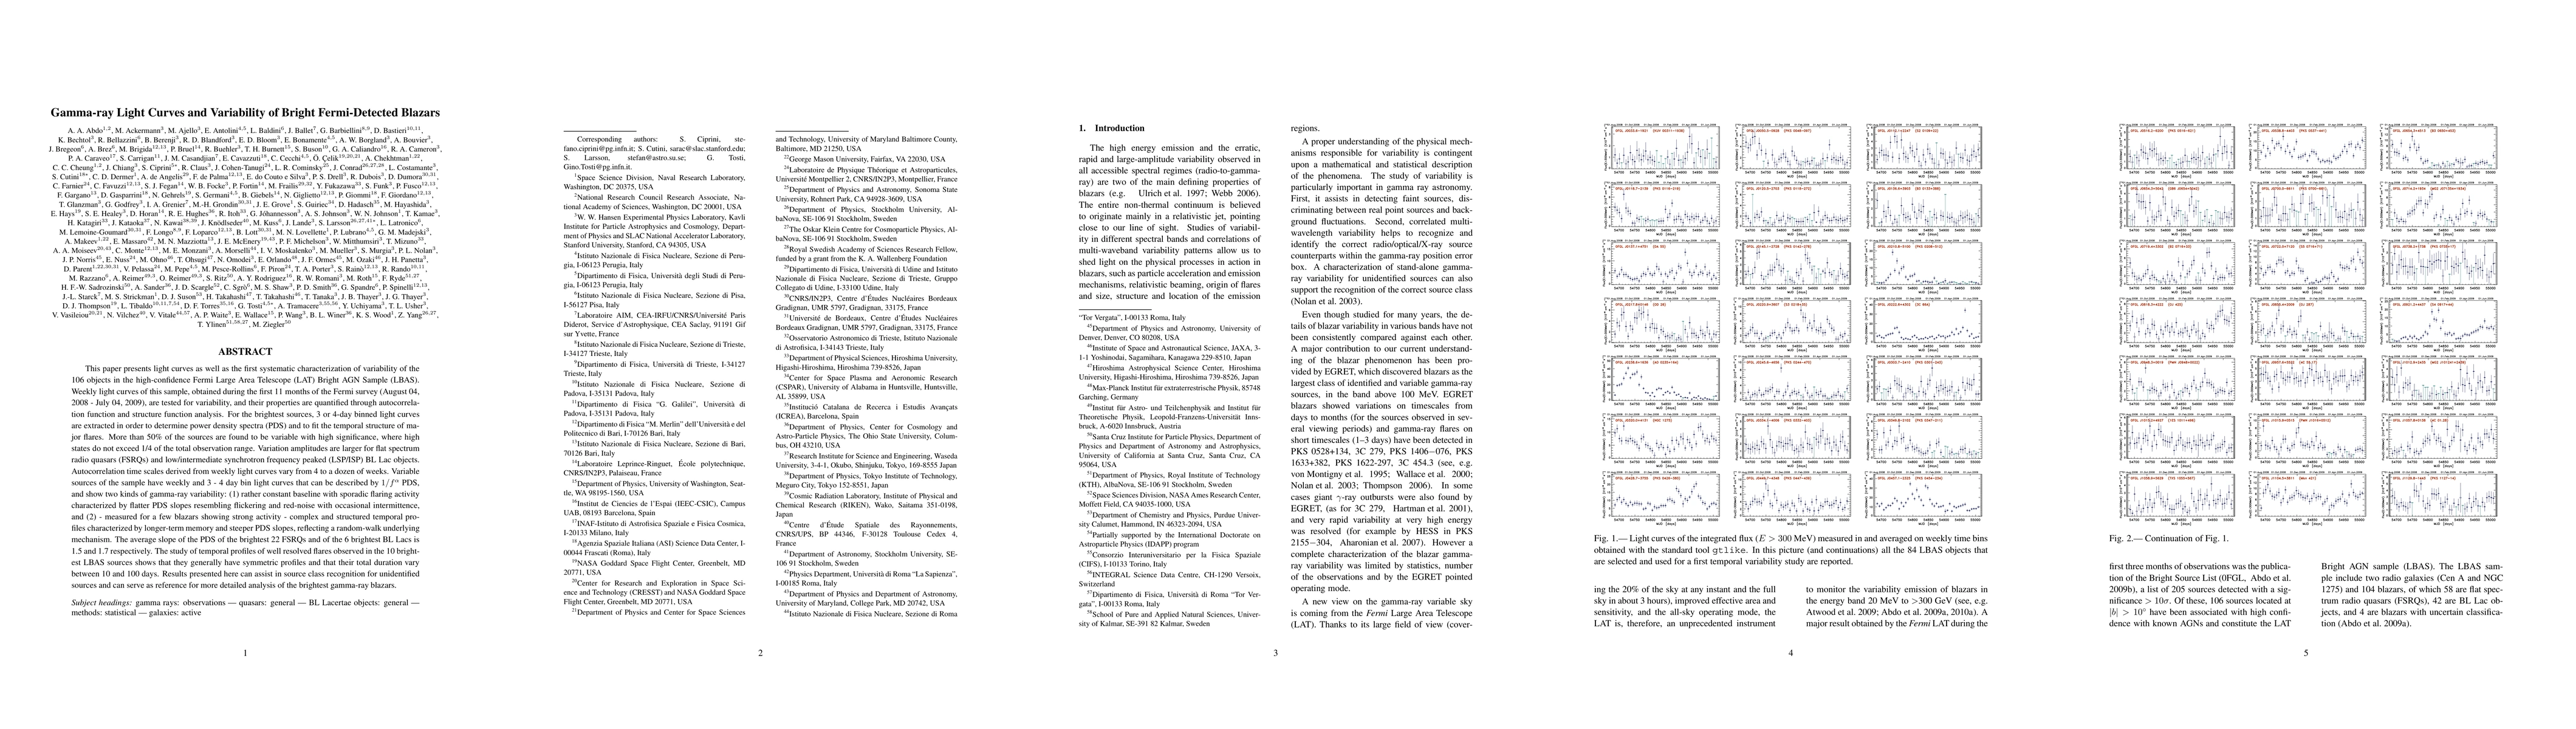
This paper presents light curves and the first systematic characterization of variability of the 106 objects in the Fermi Large Area Telescope (LAT) Bright AGN Sample (LBAS). Weekly light curves obtained during the first 11 months of survey (August 04, 2008 - July 04, 2009), are tested for variability, and their properties are quantified through autocorrelation and structure function analysis. For the brightest sources power density spectra (PDS) and fit of the temporal structure of major flares is performed. More than 50% of the sources are variable, where high states do not exceed 1/4 of the total observation range. Variation amplitudes are larger for FSRQs and low/intermediate synchrotron peaked (LSP/ISP) BL Lac objects. Autocorrelation time scales vary from 4 to a dozen of weeks. Variable sources of the sample have 1/(f^{a}) PDS and show two modes: (1) rather constant baseline with sporadic flaring activity characterized by flatter PDS slopes resembling flickering and red-noise with occasional intermittence, and (2) - measured for a few blazars showing strong activity - complex and structured temporal profiles characterized by longer-term memory and steeper PDS slopes typical of a random-walk underlying mechanism. The average PDS slope of the brightest 22 FSRQs and the 6 brightest BL Lacs is 1.5 and 1.7 respectively. The study of temporal profiles of well resolved flares shows that they generally have symmetric profiles and that their total duration vary between 10 and 100 days.
AI Key Findings
Generated Sep 03, 2025
Methodology
This study presents a systematic characterization of gamma-ray variability for 106 bright Fermi-detected blazars, utilizing weekly light curves from the first 11 months of the Fermi Large Area Telescope (LAT) survey (August 04, 2008 - July 04, 2009). Variability is assessed through autocorrelation and structure function analysis, with power density spectra (PDS) examined for major flares in the brightest sources.
Key Results
- More than 50% of the sources exhibit variability, with high states not exceeding 1/4 of the total observation range.
- Variation amplitudes are larger for FSRQs and low/intermediate synchrotron peaked (LSP/ISP) BL Lac objects.
- Autocorrelation time scales vary from 4 to a dozen of weeks.
- Variable sources show 1/(f^α) PDS with two modes: flickering (flatter PDS slopes) and red-noise with occasional intermittence, and complex, structured temporal profiles with longer-term memory and steeper PDS slopes.
- The average PDS slope for the brightest 22 FSRQs and 6 brightest BL Lacs is 1.5 and 1.7, respectively.
Significance
This research provides the first systematic characterization of gamma-ray light curves and variability of bright Fermi-detected blazars, offering insights into the variability patterns and timescales of these high-energy sources, which can enhance our understanding of blazar physics and their emission mechanisms.
Technical Contribution
The paper introduces a detailed methodology for analyzing gamma-ray light curves and variability of blazars using Fermi-LAT data, including autocorrelation, structure function, and power density spectrum analyses.
Novelty
This study offers a systematic characterization of bright Fermi-detected blazars' variability, revealing distinct variability modes and timescales, which contributes to the understanding of blazar physics beyond previous single-source or smaller-sample studies.
Limitations
- The study is limited to the first 11 months of Fermi-LAT survey data, which may not fully capture the long-term variability behavior of blazars.
- The analysis does not account for potential variations in the sources' spectral energy distributions over time.
Future Work
- Further analysis with extended datasets can provide a more comprehensive understanding of blazar variability over longer timescales.
- Investigating the relationship between gamma-ray variability and other wavelengths can offer a multi-wavelength perspective on blazar emission mechanisms.
Paper Details
PDF Preview
Key Terms
Citation Network
Current paper (gray), citations (green), references (blue)
Display is limited for performance on very large graphs.
Similar Papers
Found 4 papersGeV Variability Properties of TeV Blazars Detected by Fermi-LAT
Xin Zhang, Junhui Fan, Hubing Xiao et al.
Transient quasi-periodic oscillations in the gamma-ray light curves of bright blazars
Weitian Huang, Jinjie Yu, Nan Ding et al.
| Title | Authors | Year | Actions |
|---|
Comments (0)