Gaussian Derivative Change-point Detection for Early Warnings of Industrial System Failures
Publication
Metrics
AI Quick Summary
This paper proposes a three-step framework using Gaussian Derivative Change-Point Detection (GDCPD) to identify critical feature changes predicting industrial system failures. It employs Weighted Mahalanobis Distance for significance assessment and LSTM networks for Remaining Useful Life estimation, demonstrating effectiveness in early failure warnings.
Paper Preview
Abstract
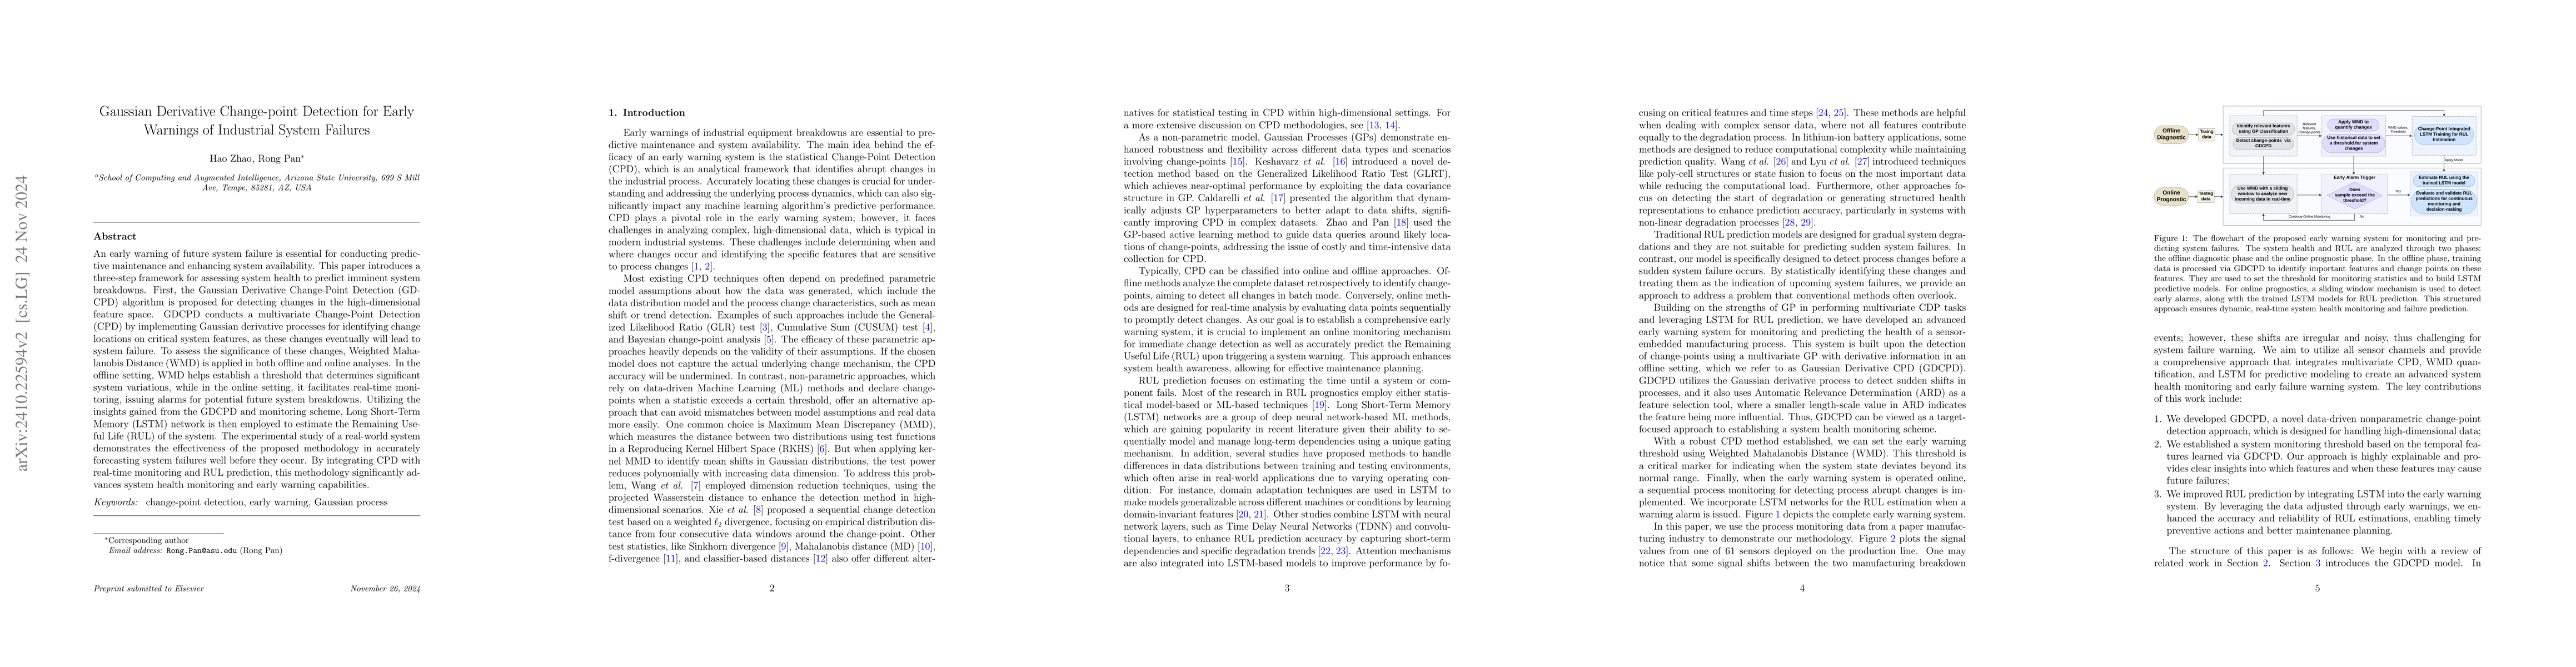
An early warning of future system failure is essential for conducting predictive maintenance and enhancing system availability. This paper introduces a three-step framework for assessing system health to predict imminent system breakdowns. First, the Gaussian Derivative Change-Point Detection (GDCPD) algorithm is proposed for detecting changes in the high-dimensional feature space. GDCPD conducts a multivariate Change-Point Detection (CPD) by implementing Gaussian derivative processes for identifying change locations on critical system features, as these changes eventually will lead to system failure. To assess the significance of these changes, Weighted Mahalanobis Distance (WMD) is applied in both offline and online analyses. In the offline setting, WMD helps establish a threshold that determines significant system variations, while in the online setting, it facilitates real-time monitoring, issuing alarms for potential future system breakdowns. Utilizing the insights gained from the GDCPD and monitoring scheme, Long Short-Term Memory (LSTM) network is then employed to estimate the Remaining Useful Life (RUL) of the system. The experimental study of a real-world system demonstrates the effectiveness of the proposed methodology in accurately forecasting system failures well before they occur. By integrating CPD with real-time monitoring and RUL prediction, this methodology significantly advances system health monitoring and early warning capabilities.
AI Key Findings
Get AI-generated insights about this paper's methodology, results, significance, and more — seven facets brought into focus.
Impact
Authors
PDF Preview
Citation Network
Current paper (gray), citations (green), references (blue)
Display is limited for performance on very large graphs.
Discussion 0