Gaussian graphical modeling for spectrometric data analysis
Publication
Metrics
AI Quick Summary
This paper proposes a Gaussian graphical model for analyzing spectrometric data, specifically infrared absorbance spectra, using B-spline basis expansion and Bayesian inference to estimate the dependence structure and induce sparsity in smoothing coefficients. The method is demonstrated through the analysis of strawberry puree spectra.
Paper Preview
Abstract
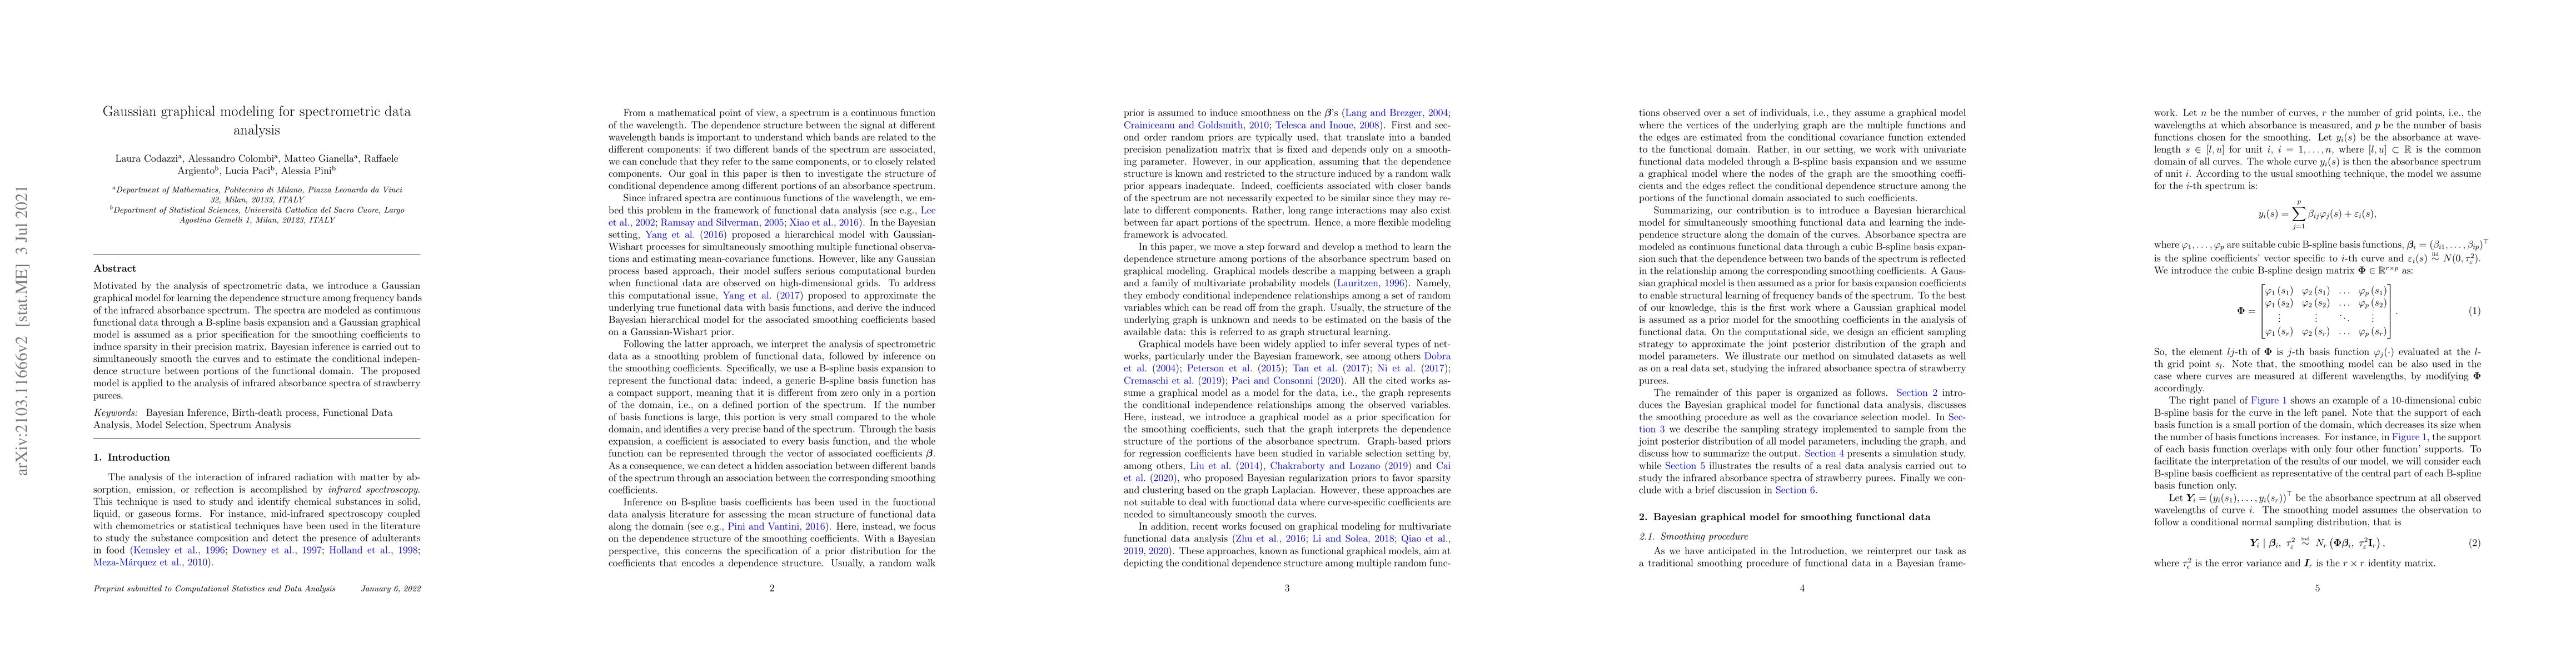
Motivated by the analysis of spectrometric data, we introduce a Gaussian graphical model for learning the dependence structure among frequency bands of the infrared absorbance spectrum. The spectra are modeled as continuous functional data through a B-spline basis expansion and a Gaussian graphical model is assumed as a prior specification for the smoothing coefficients to induce sparsity in their precision matrix. Bayesian inference is carried out to simultaneously smooth the curves and to estimate the conditional independence structure between portions of the functional domain. The proposed model is applied to the analysis of infrared absorbance spectra of strawberry purees.
AI Key Findings
Get AI-generated insights about this paper's methodology, results, significance, and more — seven facets brought into focus.
Impact
Paper Details
Authors
PDF Preview
Key Terms
Citation Network
Current paper (gray), citations (green), references (blue)
Display is limited for performance on very large graphs.
Discussion 0