Gene ranking and biomarker discovery under correlation
Publication
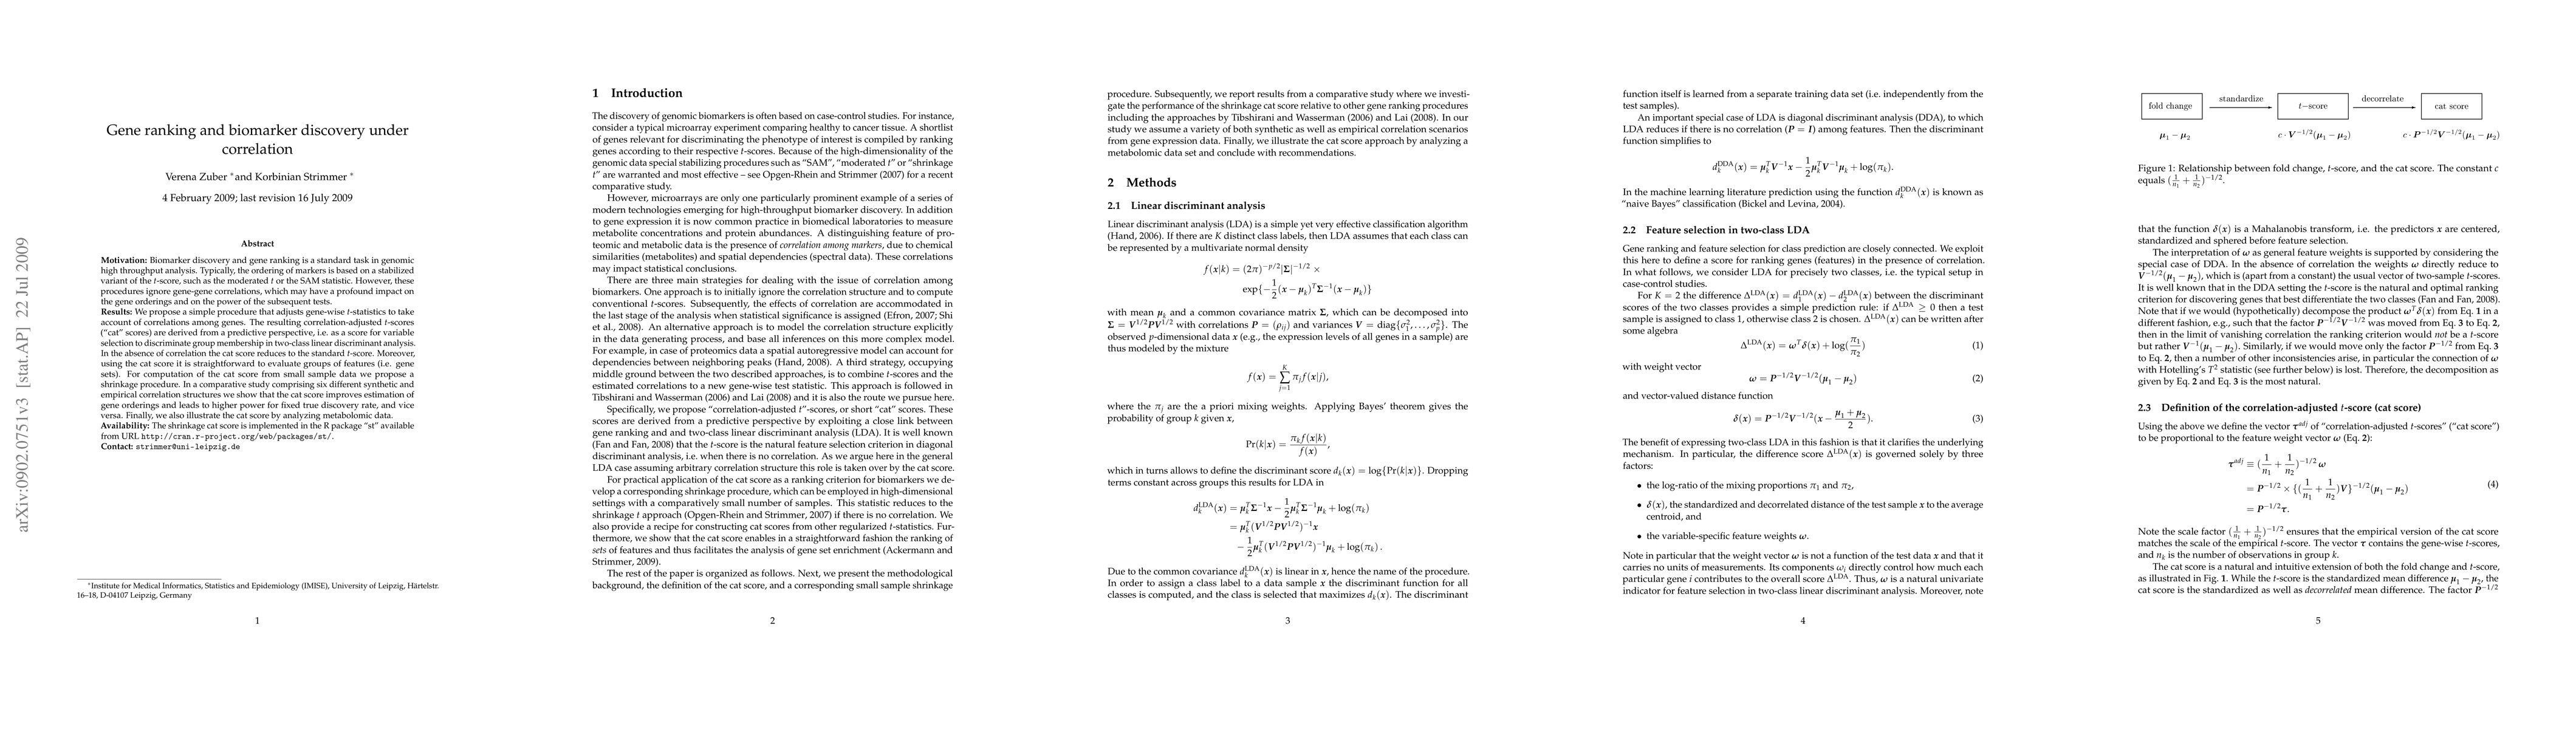
Metrics
Paper Preview
Abstract
Biomarker discovery and gene ranking is a standard task in genomic high throughput analysis. Typically, the ordering of markers is based on a stabilized variant of the t-score, such as the moderated t or the SAM statistic. However, these procedures ignore gene-gene correlations, which may have a profound impact on the gene orderings and on the power of the subsequent tests. We propose a simple procedure that adjusts gene-wise t-statistics to take account of correlations among genes. The resulting correlation-adjusted t-scores ("cat" scores) are derived from a predictive perspective, i.e. as a score for variable selection to discriminate group membership in two-class linear discriminant analysis. In the absence of correlation the cat score reduces to the standard t-score. Moreover, using the cat score it is straightforward to evaluate groups of features (i.e. gene sets). For computation of the cat score from small sample data we propose a shrinkage procedure. In a comparative study comprising six different synthetic and empirical correlation structures we show that the cat score improves estimation of gene orderings and leads to higher power for fixed true discovery rate, and vice versa. Finally, we also illustrate the cat score by analyzing metabolomic data. The shrinkage cat score is implemented in the R package "st" available from URL http://cran.r-project.org/web/packages/st/
AI Key Findings
Get AI-generated insights about this paper's methodology, results, significance, and more — seven facets brought into focus.
Impact
Paper Details
PDF Preview
Key Terms
Citation Network
Current paper (gray), citations (green), references (blue)
Display is limited for performance on very large graphs.
Discussion 0