Generalized Analytical Estimation of Sensitivity Matrices in Unbalanced Distribution Networks
Publication
Metrics
AI Quick Summary
This paper proposes a generalized analytical method for estimating sensitivity matrices in unbalanced distribution networks, considering various load types and distributed energy resources (DERs) with smart inverters. The new matrix-based algorithm accurately captures voltage magnitude and angle sensitivity, and is validated through extensive case studies on IEEE networks.
Paper Preview
Abstract
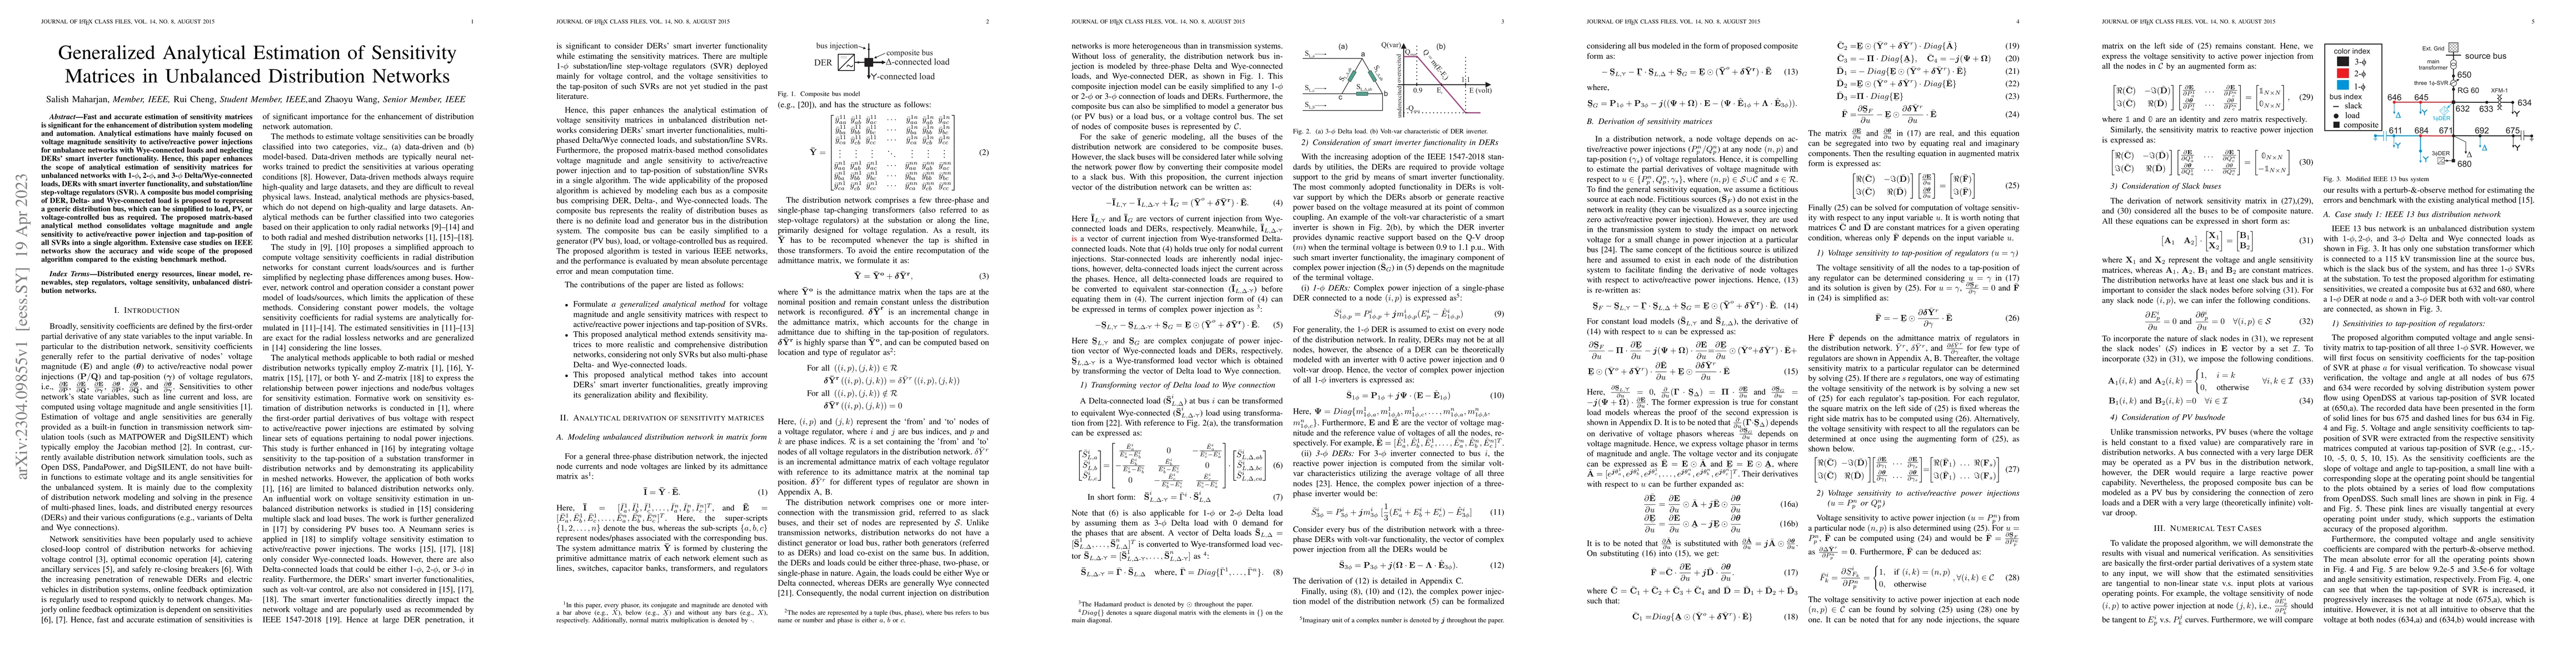
Fast and accurate estimation of sensitivity matrices is significant for the enhancement of distribution system modeling and automation. Analytical estimations have mainly focused on voltage magnitude sensitivity to active/reactive power injections for unbalance networks with Wye-connected loads and neglecting DERs' smart inverter functionality. Hence, this paper enhances the scope of analytical estimation of sensitivity matrices for unbalanced networks with 1-phase, 2-phase, and 3-phase Delta/Wye-connected loads, DERs with smart inverter functionality, and substation/line step-voltage regulators (SVR). A composite bus model comprising of DER, Delta- and Wye-connected load is proposed to represent a generic distribution bus, which can be simplified to load, PV, or voltage-controlled bus as required. The proposed matrix-based analytical method consolidates voltage magnitude and angle sensitivity to active/reactive power injection and tap-position of all SVRs into a single algorithm. Extensive case studies on IEEE networks show the accuracy and wide scope of the proposed algorithm compared to the existing benchmark method.
AI Key Findings
Get AI-generated insights about this paper's methodology, results, significance, and more — seven facets brought into focus.
Impact
Paper Details
Authors
PDF Preview
Key Terms
Citation Network
Current paper (gray), citations (green), references (blue)
Display is limited for performance on very large graphs.
Discussion 0