Generalized Biplots for Multidimensional Scaled Projections
Publication
Metrics
AI Quick Summary
This paper proposes a generalized biplot method for visualizing multidimensional scaled projections, allowing for user-specified stress and dissimilarity metrics, and providing an alternative to traditional PCA-derived biplots.
Paper Preview
Abstract
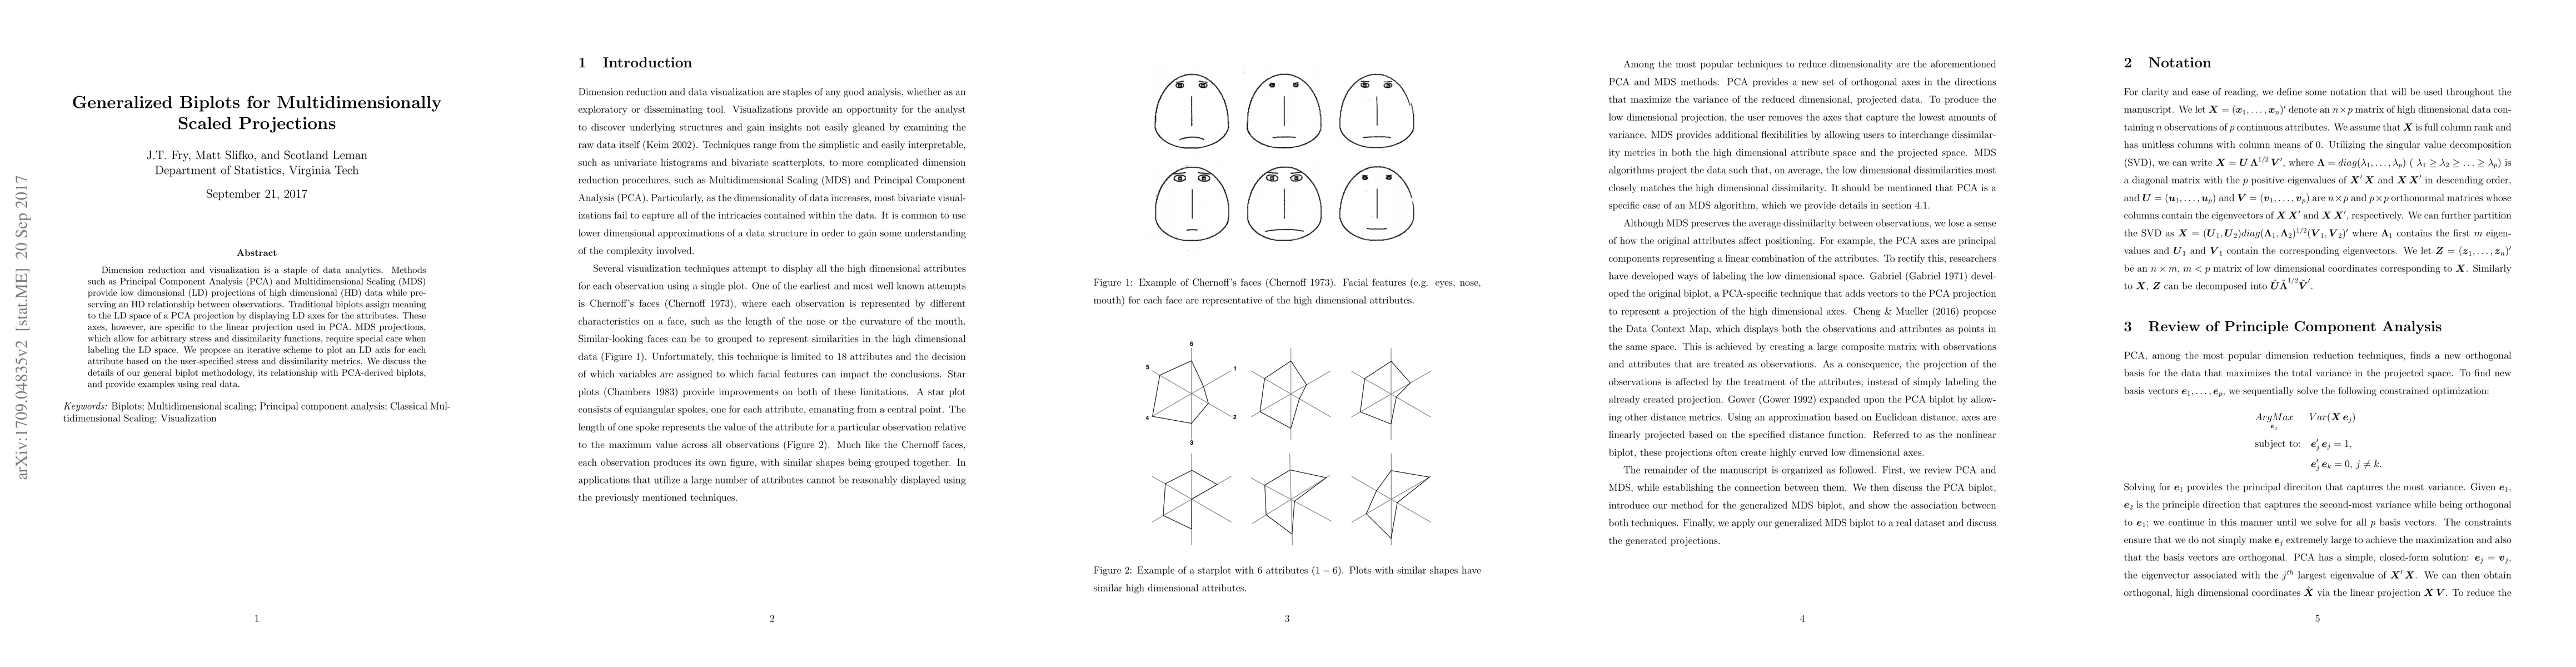
Dimension reduction and visualization is a staple of data analytics. Methods such as Principal Component Analysis (PCA) and Multidimensional Scaling (MDS) provide low dimensional (LD) projections of high dimensional (HD) data while preserving an HD relationship between observations. Traditional biplots assign meaning to the LD space of a PCA projection by displaying LD axes for the attributes. These axes, however, are specific to the linear projection used in PCA. MDS projections, which allow for arbitrary stress and dissimilarity functions, require special care when labeling the LD space. We propose an iterative scheme to plot an LD axis for each attribute based on the user-specified stress and dissimilarity metrics. We discuss the details of our general biplot methodology, its relationship with PCA-derived biplots, and provide examples using real data.
AI Key Findings
Get AI-generated insights about this paper's methodology, results, significance, and more — seven facets brought into focus.
Impact
Paper Details
PDF Preview
Key Terms
Citation Network
Current paper (gray), citations (green), references (blue)
Display is limited for performance on very large graphs.
Discussion 0