Generalized Linear Randomized Response Modeling using GLMMRR
Publication
Metrics
AI Quick Summary
The paper introduces GLMMRR, a package for modeling randomized response data using generalized linear mixed models, which includes modified link functions for various cumulative distributions. It facilitates the analysis of sensitive behavior data through mixed modeling frameworks, offering enhanced model-fit tests and residual analysis.
Paper Preview
Abstract
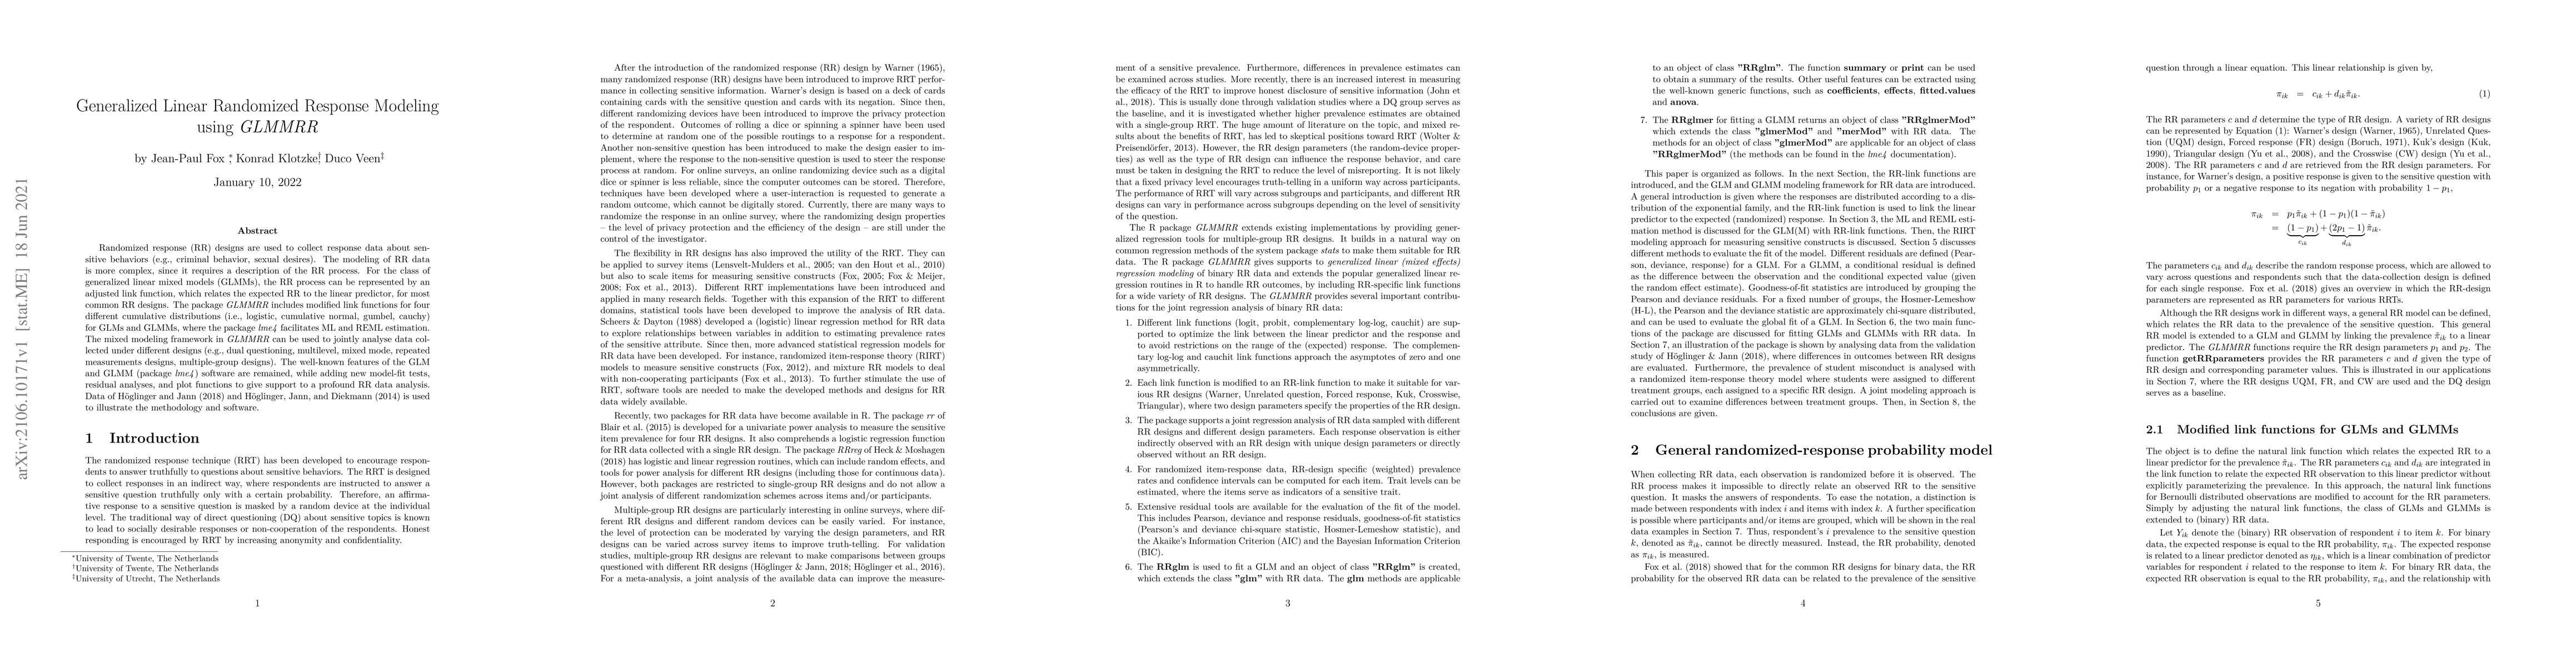
Randomized response (RR) designs are used to collect response data about sensitive behaviors (e.g., criminal behavior, sexual desires). The modeling of RR data is more complex, since it requires a description of the RR process. For the class of generalized linear mixed models (GLMMs), the RR process can be represented by an adjusted link function, which relates the expected RR to the linear predictor, for most common RR designs. The package GLMMRR includes modified link functions for four different cumulative distributions (i.e., logistic, cumulative normal, gumbel, cauchy) for GLMs and GLMMs, where the package lme4 facilitates ML and REML estimation. The mixed modeling framework in GLMMRR can be used to jointly analyse data collected under different designs (e.g., dual questioning, multilevel, mixed mode, repeated measurements designs, multiple-group designs). The well-known features of the GLM and GLMM (package lme4) software are remained, while adding new model-fit tests, residual analyses, and plot functions to give support to a profound RR data analysis. Data of H\"{o}glinger and Jann (2018) and H\"{o}glinger, Jann, and Diekmann (2014) is used to illustrate the methodology and software.
AI Key Findings
Get AI-generated insights about this paper's methodology, results, significance, and more — seven facets brought into focus.
Impact
Paper Details
Authors
PDF Preview
Key Terms
Citation Network
Current paper (gray), citations (green), references (blue)
Display is limited for performance on very large graphs.
Discussion 0