Generalized Multivariate Functional Additive Mixed Models for Location, Scale, and Shape
Publication
Metrics
AI Quick Summary
This paper proposes a flexible regression framework for modeling multilevel generalized multivariate functional data, including mixed types like binary and continuous data. It uses additive functional models and latent multivariate Gaussian processes, with implementation available in the R package 'gmfamm' and demonstrated through a simulation study and an application to traffic data in Berlin.
Paper Preview
Abstract
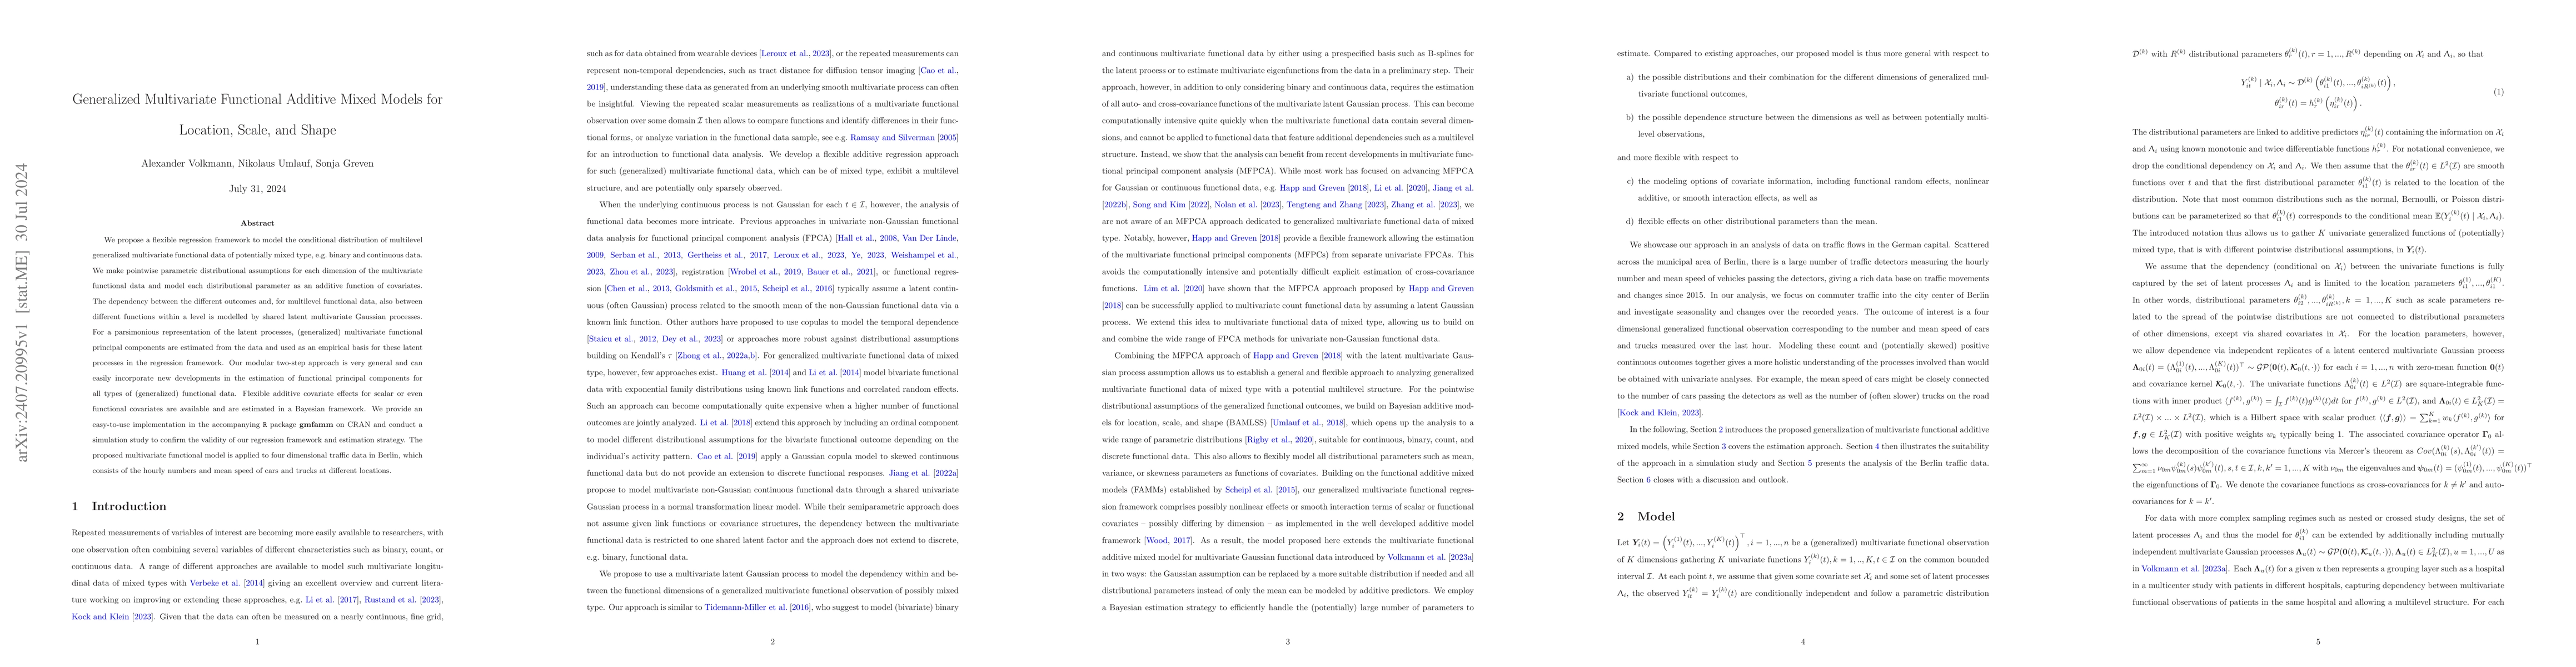
We propose a flexible regression framework to model the conditional distribution of multilevel generalized multivariate functional data of potentially mixed type, e.g. binary and continuous data. We make pointwise parametric distributional assumptions for each dimension of the multivariate functional data and model each distributional parameter as an additive function of covariates. The dependency between the different outcomes and, for multilevel functional data, also between different functions within a level is modelled by shared latent multivariate Gaussian processes. For a parsimonious representation of the latent processes, (generalized) multivariate functional principal components are estimated from the data and used as an empirical basis for these latent processes in the regression framework. Our modular two-step approach is very general and can easily incorporate new developments in the estimation of functional principal components for all types of (generalized) functional data. Flexible additive covariate effects for scalar or even functional covariates are available and are estimated in a Bayesian framework. We provide an easy-to-use implementation in the accompanying R package 'gmfamm' on CRAN and conduct a simulation study to confirm the validity of our regression framework and estimation strategy. The proposed multivariate functional model is applied to four dimensional traffic data in Berlin, which consists of the hourly numbers and mean speed of cars and trucks at different locations.
AI Key Findings
Get AI-generated insights about this paper's methodology, results, significance, and more — seven facets brought into focus.
Authors
PDF Preview
Related Papers
No references found for this paper.
Discussion 0