Generating Clustered Journal Maps: An Automated System for Hierarchical Classification
Publication
Metrics
AI Quick Summary
This paper presents an automated system for generating clustered journal maps using VOSviewer, which classifies 11,359 journals from the 2015 Journal Citation Reports. The system visualizes hierarchical clusters and allows for comparison across years, highlighting field delineations' sensitivity to changes.
Paper Preview
Abstract
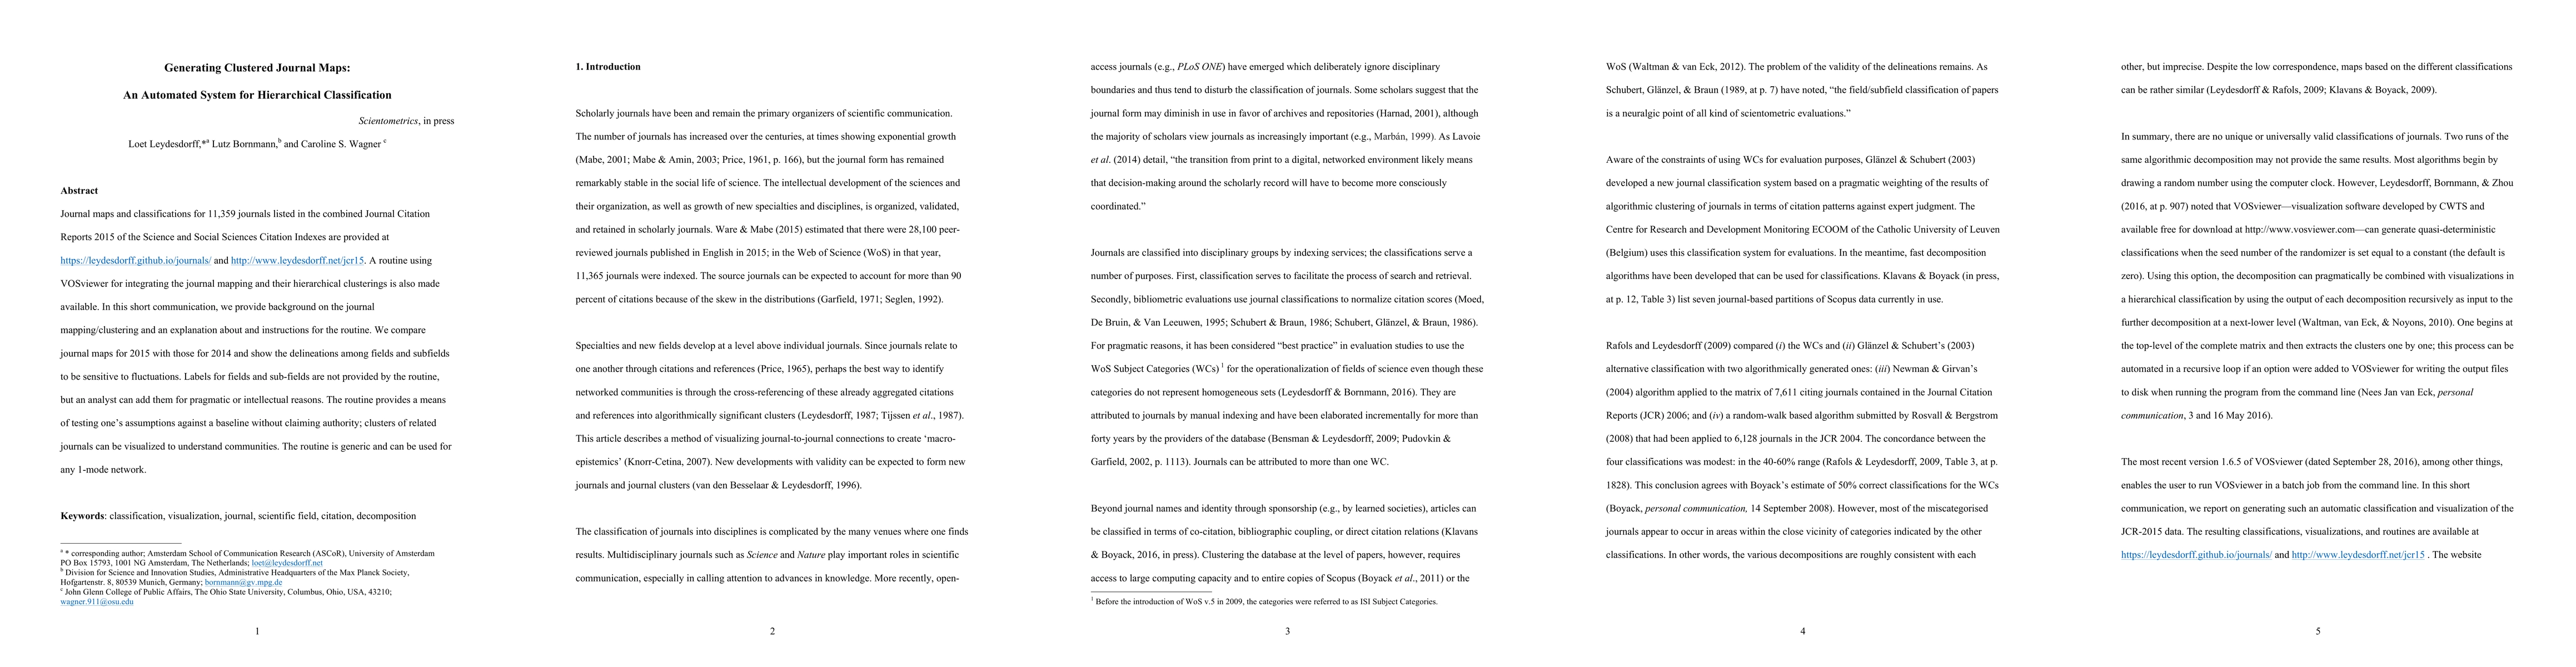
Journal maps and classifications for 11,359 journals listed in the combined Journal Citation Reports 2015 of the Science and Social Sciences Citation Indexes are provided at http://www.leydesdorff.net/jcr15. A routine using VOSviewer for integrating the journal mapping and their hierarchical clustering is also made available. In this short communication, we provide background on the journal mapping/clustering and an explanation and instructions about the routine. We compare 2015 journal maps with those for 2014 and show the delineations among fields and subfields to be sensitive to fluctuations. Labels for fields and sub-fields are not provided by the routine, but can be added by an analyst for pragmatic or intellectual reasons. The routine provides a means for testing one's assumptions against a baseline without claiming authority, clusters of related journals can be visualized to understand communities. The routine is generic and can be used for any 1-mode network.
AI Key Findings
Get AI-generated insights about this paper's methodology, results, significance, and more — seven facets brought into focus.
Impact
Paper Details
PDF Preview
Key Terms
Citation Network
Current paper (gray), citations (green), references (blue)
Display is limited for performance on very large graphs.
Discussion 0