Generation of synthetic gait data: application to multiple sclerosis patients' gait patterns
Publication
Metrics
AI Quick Summary
This paper proposes a framework for transforming unit quaternion time series data into a synthetic form suitable for generating high-fidelity gait data using nearest neighbor weighting, addressing small sample sizes in MS clinical studies. The synthetic data maintains the initial geometry, enabling improved stability in gait analysis clustering methods.
Paper Preview
Abstract
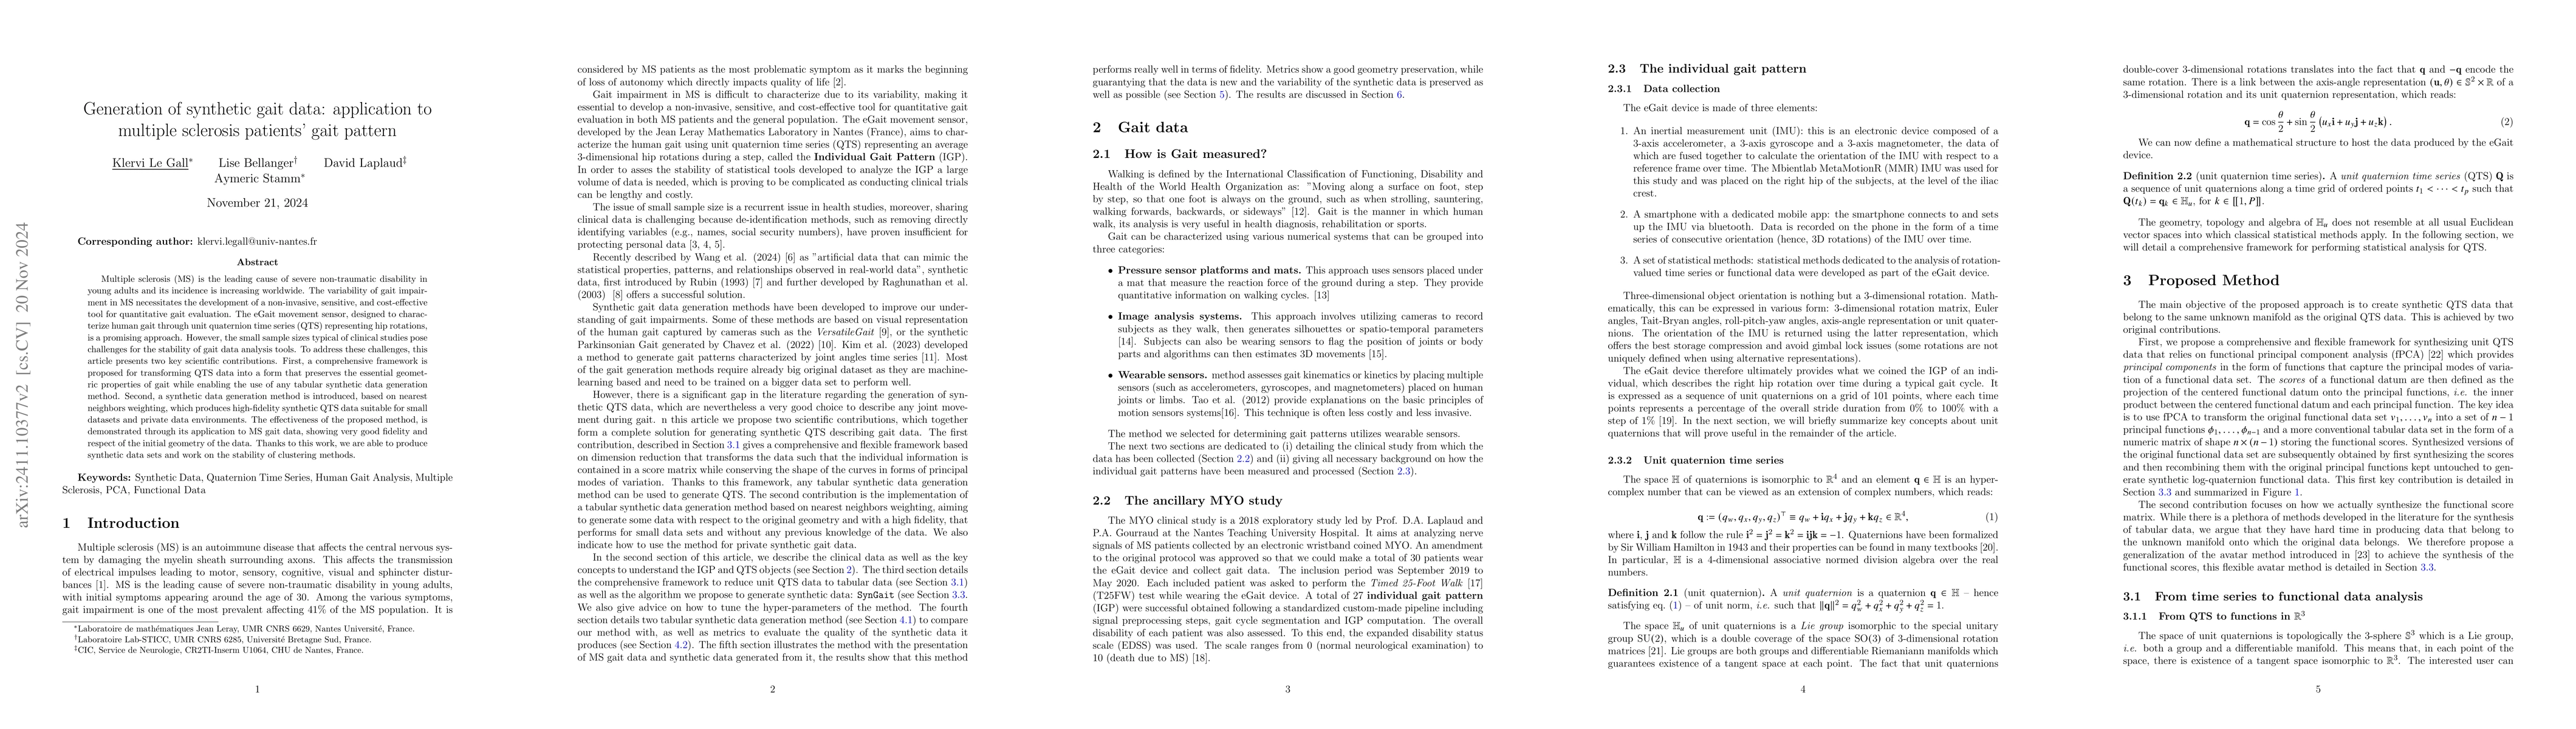
Multiple sclerosis (MS) is the leading cause of severe non-traumatic disability in young adults and its incidence is increasing worldwide. The variability of gait impairment in MS necessitates the development of a non-invasive, sensitive, and cost-effective tool for quantitative gait evaluation. The eGait movement sensor, designed to characterize human gait through unit quaternion time series (QTS) representing hip rotations, is a promising approach. However, the small sample sizes typical of clinical studies pose challenges for the stability of gait data analysis tools. To address these challenges, this article presents two key scientific contributions. First, a comprehensive framework is proposed for transforming QTS data into a form that preserves the essential geometric properties of gait while enabling the use of any tabular synthetic data generation method. Second, a synthetic data generation method is introduced, based on nearest neighbors weighting, which produces high-fidelity synthetic QTS data suitable for small datasets and private data environments. The effectiveness of the proposed method, is demonstrated through its application to MS gait data, showing very good fidelity and respect of the initial geometry of the data. Thanks to this work, we are able to produce synthetic data sets and work on the stability of clustering methods.
AI Key Findings
Get AI-generated insights about this paper's methodology, results, significance, and more — seven facets brought into focus.
Authors
PDF Preview
Related Papers
No references found for this paper.
Discussion 0