Publication
Metrics
AI Quick Summary
This paper proposes a novel workflow combining Mapper and differential gene expression to analyze RNA-seq data, revealing distinct gene regulations in tumor subgroups that suggest different lung cancer formation paths. It also introduces a scoring method using heat kernel signatures for statistical analysis of Mapper structures.
Paper Preview
Abstract
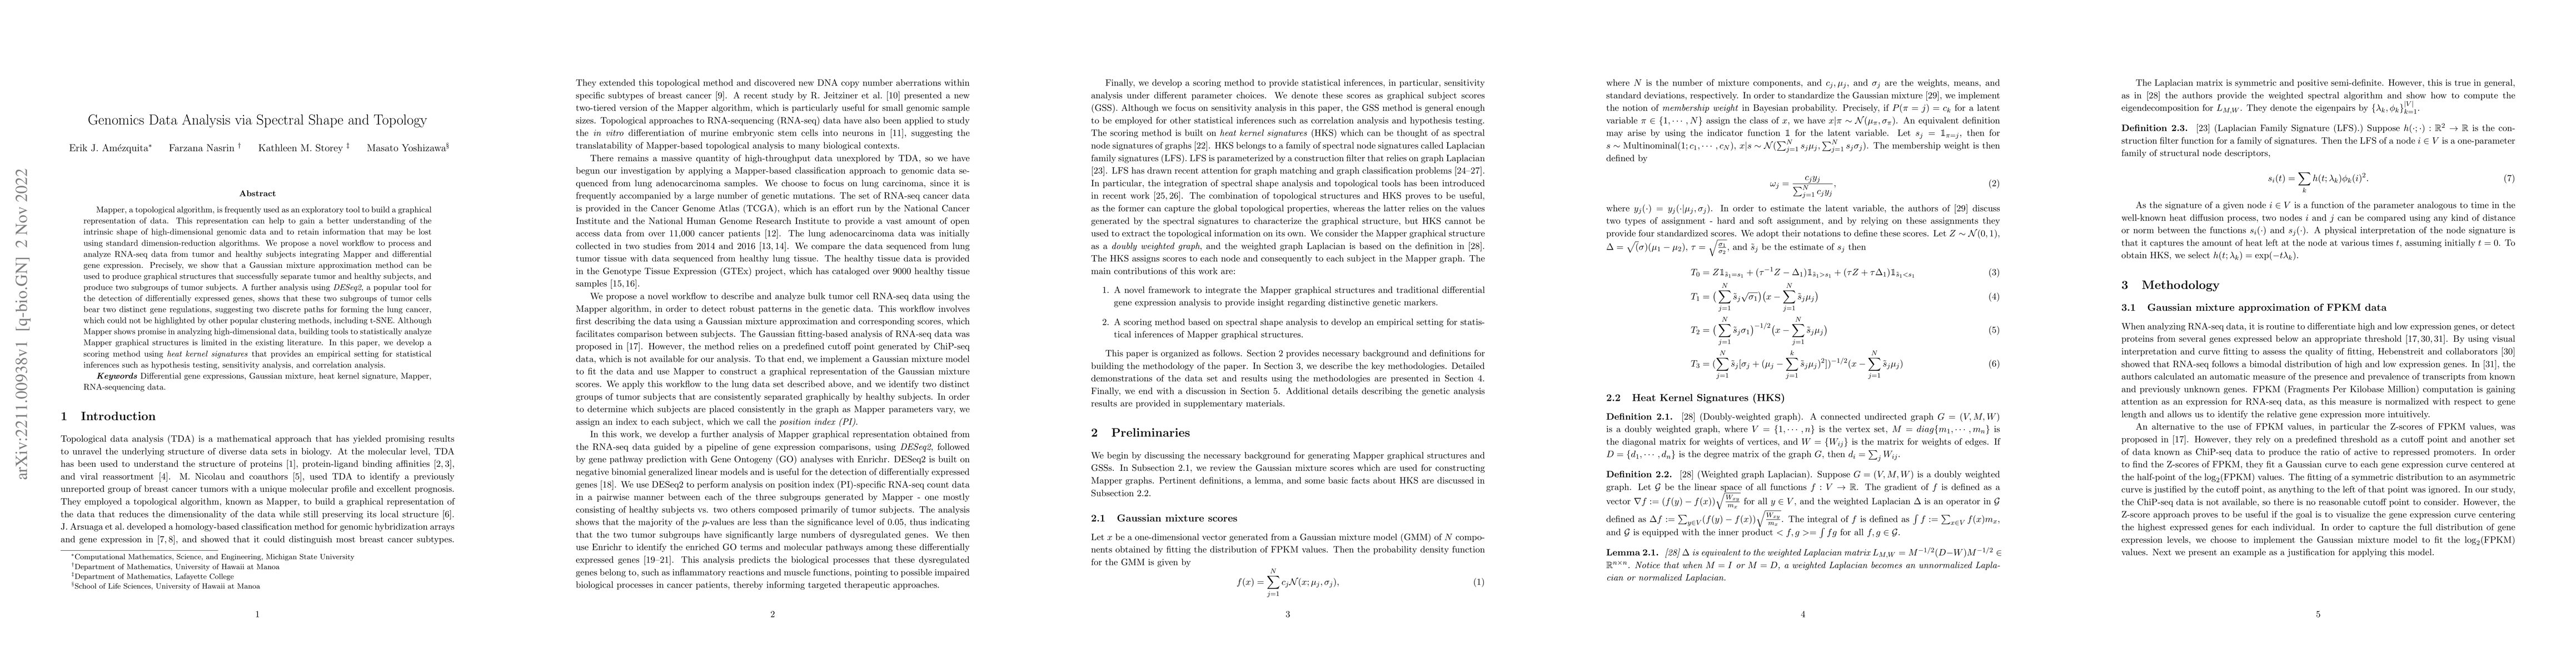
Mapper, a topological algorithm, is frequently used as an exploratory tool to build a graphical representation of data. This representation can help to gain a better understanding of the intrinsic shape of high-dimensional genomic data and to retain information that may be lost using standard dimension-reduction algorithms. We propose a novel workflow to process and analyze RNA-seq data from tumor and healthy subjects integrating Mapper and differential gene expression. Precisely, we show that a Gaussian mixture approximation method can be used to produce graphical structures that successfully separate tumor and healthy subjects, and produce two subgroups of tumor subjects. A further analysis using DESeq2, a popular tool for the detection of differentially expressed genes, shows that these two subgroups of tumor cells bear two distinct gene regulations, suggesting two discrete paths for forming lung cancer, which could not be highlighted by other popular clustering methods, including t-SNE. Although Mapper shows promise in analyzing high-dimensional data, building tools to statistically analyze Mapper graphical structures is limited in the existing literature. In this paper, we develop a scoring method using heat kernel signatures that provides an empirical setting for statistical inferences such as hypothesis testing, sensitivity analysis, and correlation analysis.
AI Key Findings
Get AI-generated insights about this paper's methodology, results, significance, and more — seven facets brought into focus.
Impact
Paper Details
Authors
PDF Preview
Key Terms
Citation Network
Current paper (gray), citations (green), references (blue)
Display is limited for performance on very large graphs.
Discussion 0