Geographic Information Systems in Evaluation and Visualization of Construction Schedule
Publication
Metrics
Paper Preview
Abstract
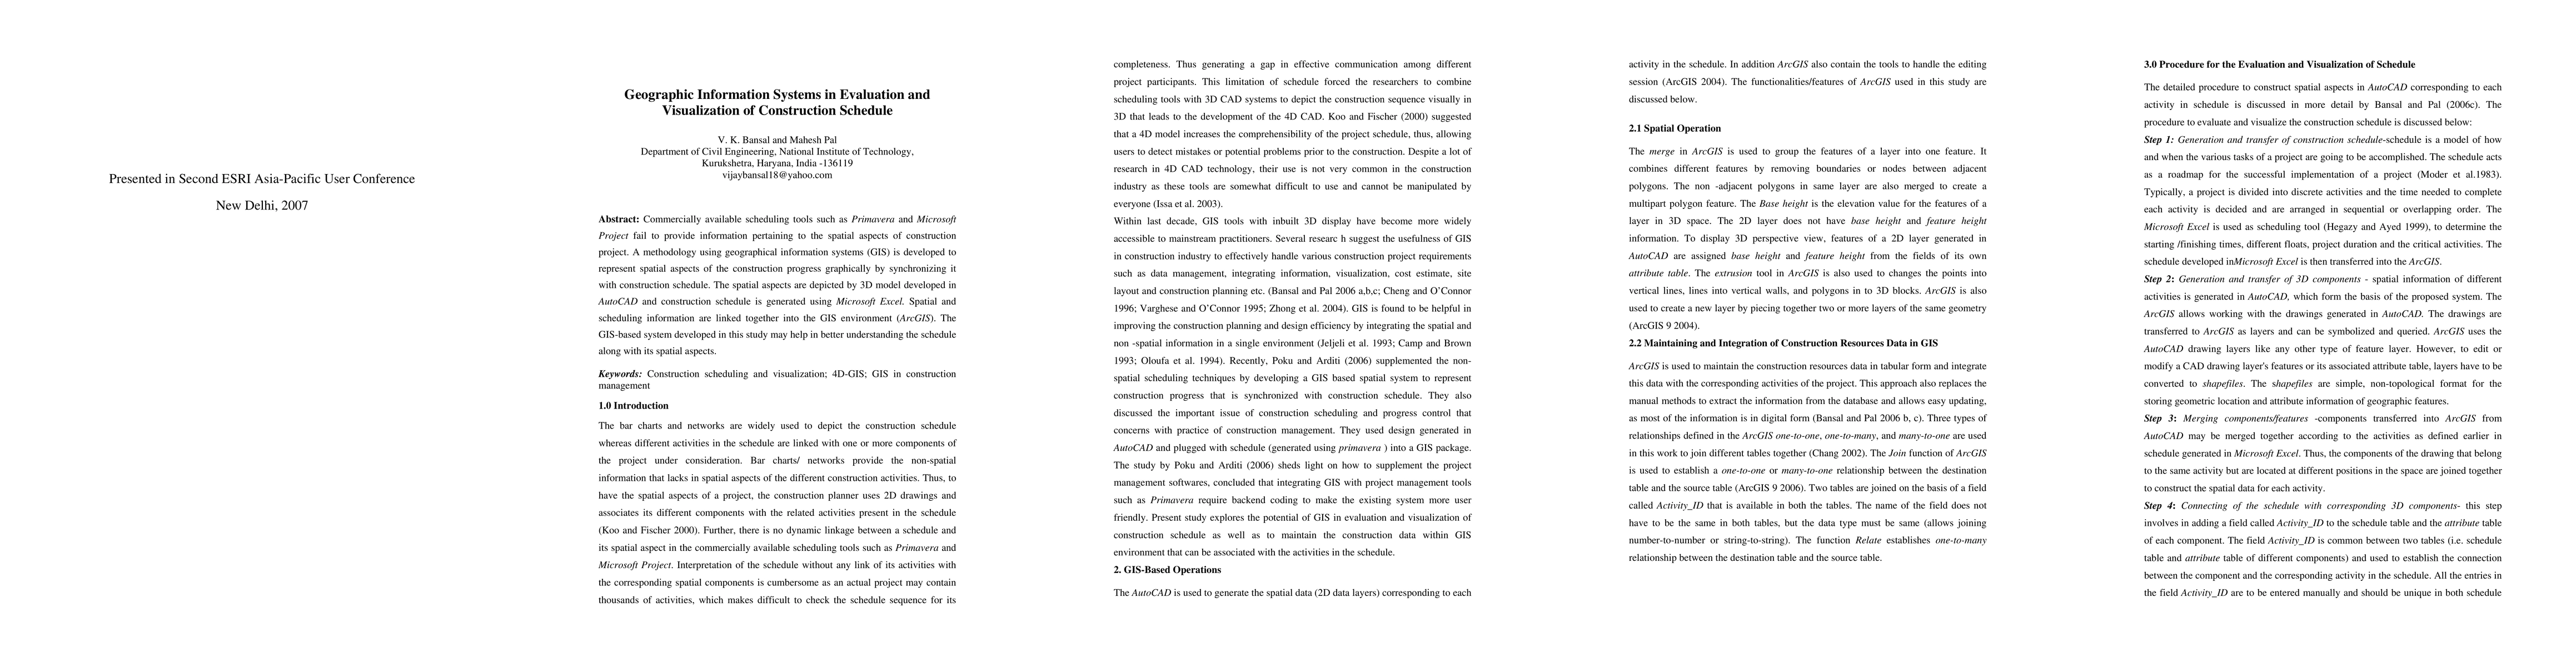
Commercially available scheduling tools such as Primavera and Microsoft Project fail to provide information pertaining to the spatial aspects of construction project. A methodology using geographical information systems (GIS) is developed to represent spatial aspects of the construction progress graphically by synchronizing it with construction schedule. The spatial aspects are depicted by 3D model developed in AutoCAD and construction schedule is generated using Microsoft Excel. Spatial and scheduling information are linked together into the GIS environment (ArcGIS). The GIS-based system developed in this study may help in better understanding the schedule along with its spatial aspects.
AI Key Findings
Get AI-generated insights about this paper's methodology, results, significance, and more — seven facets brought into focus.
Impact
Paper Details
PDF Preview
Key Terms
Citation Network
Current paper (gray), citations (green), references (blue)
Display is limited for performance on very large graphs.
Discussion 0