Geoplotlib: a Python Toolbox for Visualizing Geographical Data
Publication
Metrics
AI Quick Summary
Geoplotlib is an open-source Python toolbox for creating interactive geographical visualizations, offering features like dot maps, kernel density estimation, and Voronoi tesselation, all in pure Python. It supports hardware-accelerated visualizations and includes various spatial data visualization techniques.
Paper Preview
Abstract
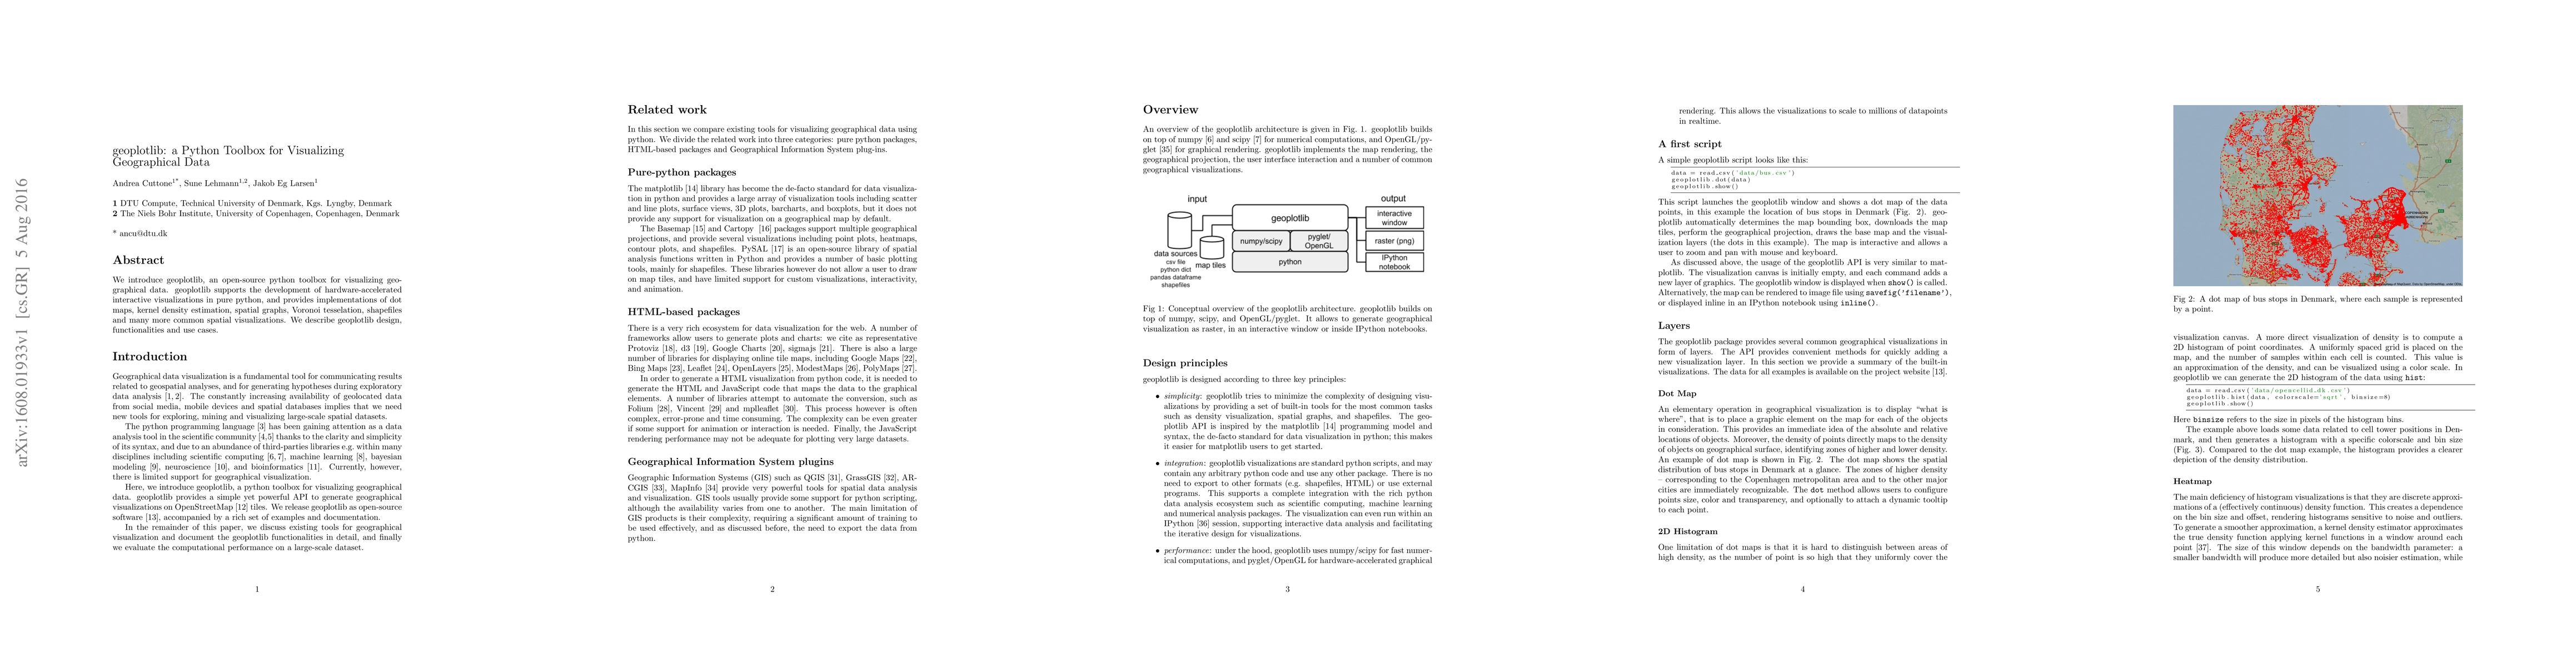
We introduce geoplotlib, an open-source python toolbox for visualizing geographical data. geoplotlib supports the development of hardware-accelerated interactive visualizations in pure python, and provides implementations of dot maps, kernel density estimation, spatial graphs, Voronoi tesselation, shapefiles and many more common spatial visualizations. We describe geoplotlib design, functionalities and use cases.
AI Key Findings
Get AI-generated insights about this paper's methodology, results, significance, and more — seven facets brought into focus.
Impact
Paper Details
PDF Preview
Key Terms
Citation Network
Current paper (gray), citations (green), references (blue)
Display is limited for performance on very large graphs.
Discussion 0