Summary
Urban transportation plays a vital role in modern city life, affecting how efficiently people and goods move around. This study analyzes transportation patterns using two datasets: the NYC Taxi Trip dataset from New York City and the Pathao Food Trip dataset from Dhaka, Bangladesh. Our goal is to identify key trends in demand, peak times, and important geographical hotspots. We start with Exploratory Data Analysis (EDA) to understand the basic characteristics of the datasets. Next, we perform geospatial analysis to map out high-demand and low-demand regions. We use the SARIMAX model for time series analysis to forecast demand patterns, capturing seasonal and weekly variations. Lastly, we apply clustering techniques to identify significant areas of high and low demand. Our findings provide valuable insights for optimizing fleet management and resource allocation in both passenger transport and food delivery services. These insights can help improve service efficiency, better meet customer needs, and enhance urban transportation systems in diverse urban environments.
AI Key Findings
Generated May 28, 2025
Methodology
The study utilized Exploratory Data Analysis (EDA), geospatial analysis, time series analysis via SARIMAX model, and clustering techniques to analyze transportation patterns in NYC taxis and Pathao food deliveries.
Key Results
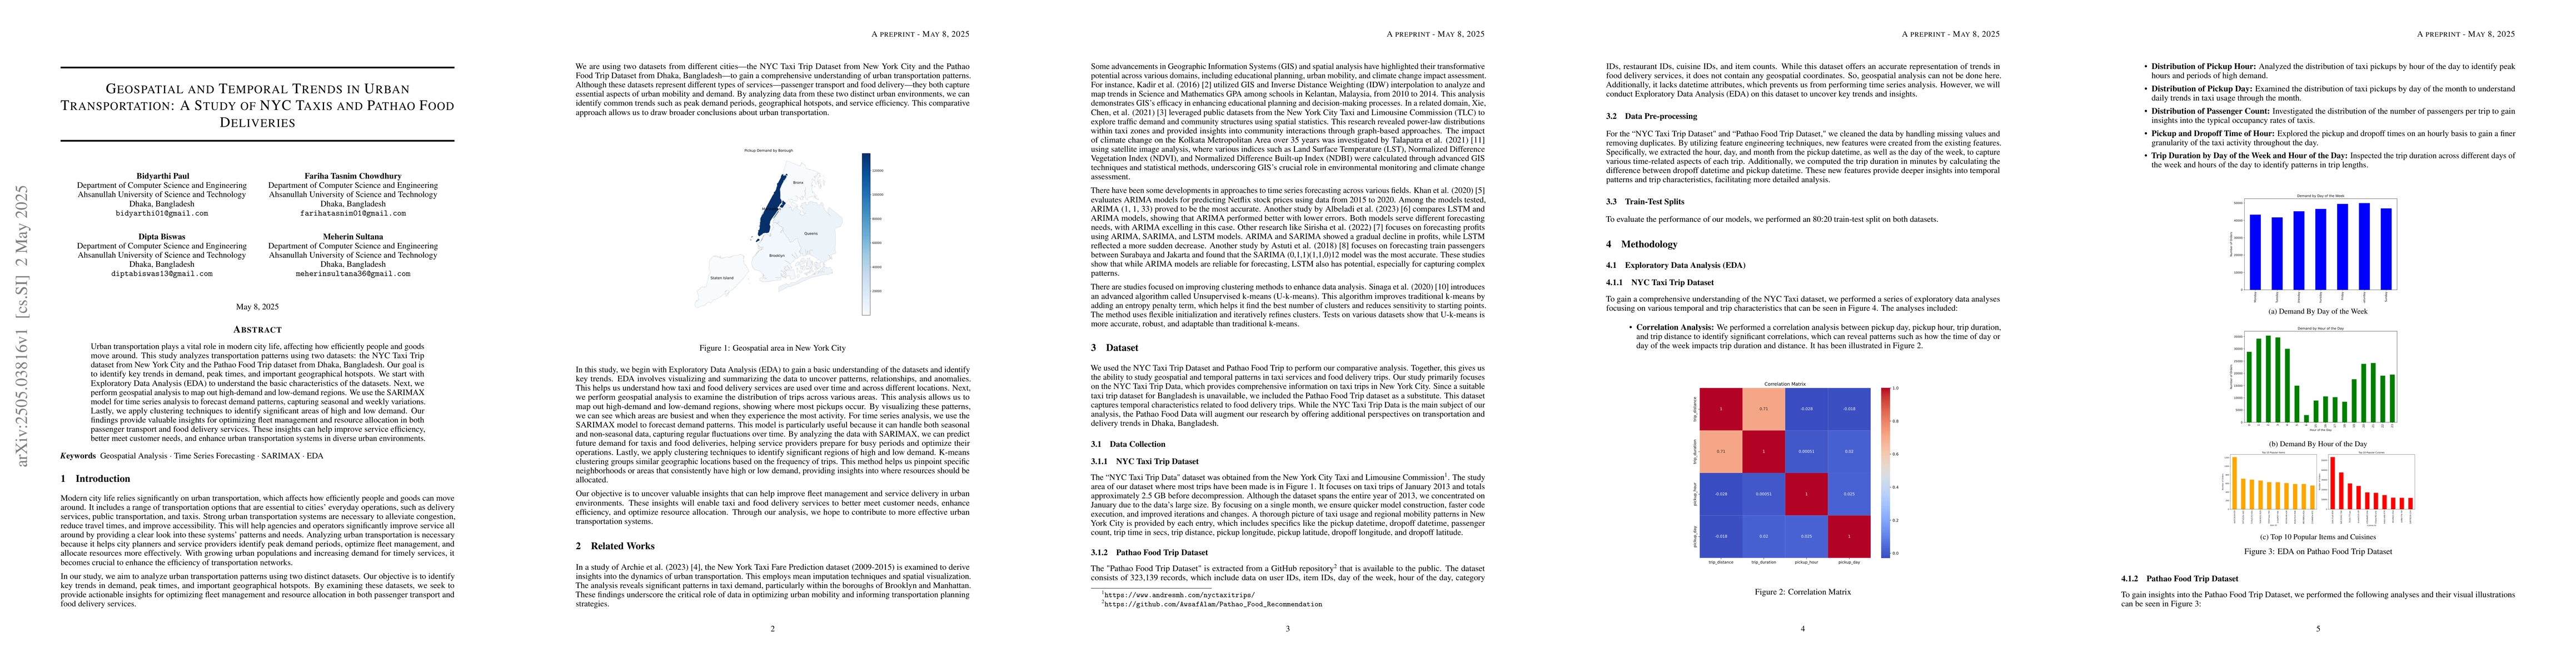
- Manhattan consistently experiences the highest taxi pickup frequency, indicating its status as a major hub of activity.
- Staten Island has significantly lower taxi pickup rates, suggesting less demand in this area.
- Pathao food delivery demand peaks on weekends, particularly Fridays and Saturdays.
- The SARIMAX model effectively captured weekly seasonality in taxi demand, providing insights into fluctuations.
- Taxi trips take longer after midday, suggesting increased congestion or longer distances.
Significance
This research offers valuable insights for optimizing fleet management and resource allocation in urban transportation systems, improving service efficiency, and meeting customer needs.
Technical Contribution
The study's main technical contribution is the application of SARIMAX for time series analysis, capturing both seasonal and weekly variations in taxi demand, and K-means clustering for identifying significant geographical hotspots.
Novelty
This work stands out by combining geospatial and temporal trend analysis in urban transportation, providing a comprehensive understanding of demand patterns in both taxi and food delivery services.
Limitations
- The study was constrained by resource limitations, analyzing only a single month (January) for the NYC Taxi Trip Dataset.
- The Pathao Food Trip Dataset lacks geospatial coordinates, preventing geospatial analysis on this dataset.
Future Work
- Further research using more extensive datasets to validate and refine these insights.
- Investigating additional urban environments to assess the generalizability of findings.
Paper Details
PDF Preview
Citation Network
Current paper (gray), citations (green), references (blue)
Display is limited for performance on very large graphs.
Similar Papers
Found 4 papersShared lightweight autonomous vehicles for urban food deliveries: A simulation study
Kent Larson, Ainhoa Genua Cerviño, Naroa Coretti Sanchez et al.
Towards Spatio-Temporal Cross-Platform Graph Embedding Fusion for Urban Traffic Flow Prediction
James Maniscalco, Suining He, Mahan Tabatabaie et al.
Exploring Urban Mobility Trends using Cellular Network Data
Adil Rasheed, Oluwaleke Yusuf, Frank Lindseth
No citations found for this paper.
Comments (0)