Geovisual Analytics and Interactive Machine Learning for Situational Awareness
Publication
Metrics
AI Quick Summary
This paper discusses the development of the Social Media Analytics Reporting Toolkit (SMART), a visual analytics platform designed to enhance first responders' situational awareness through real-time data from social media. The platform's success is attributed to its user-centered design, interactive visualizations, and interactive machine learning capabilities.
Paper Preview
Abstract
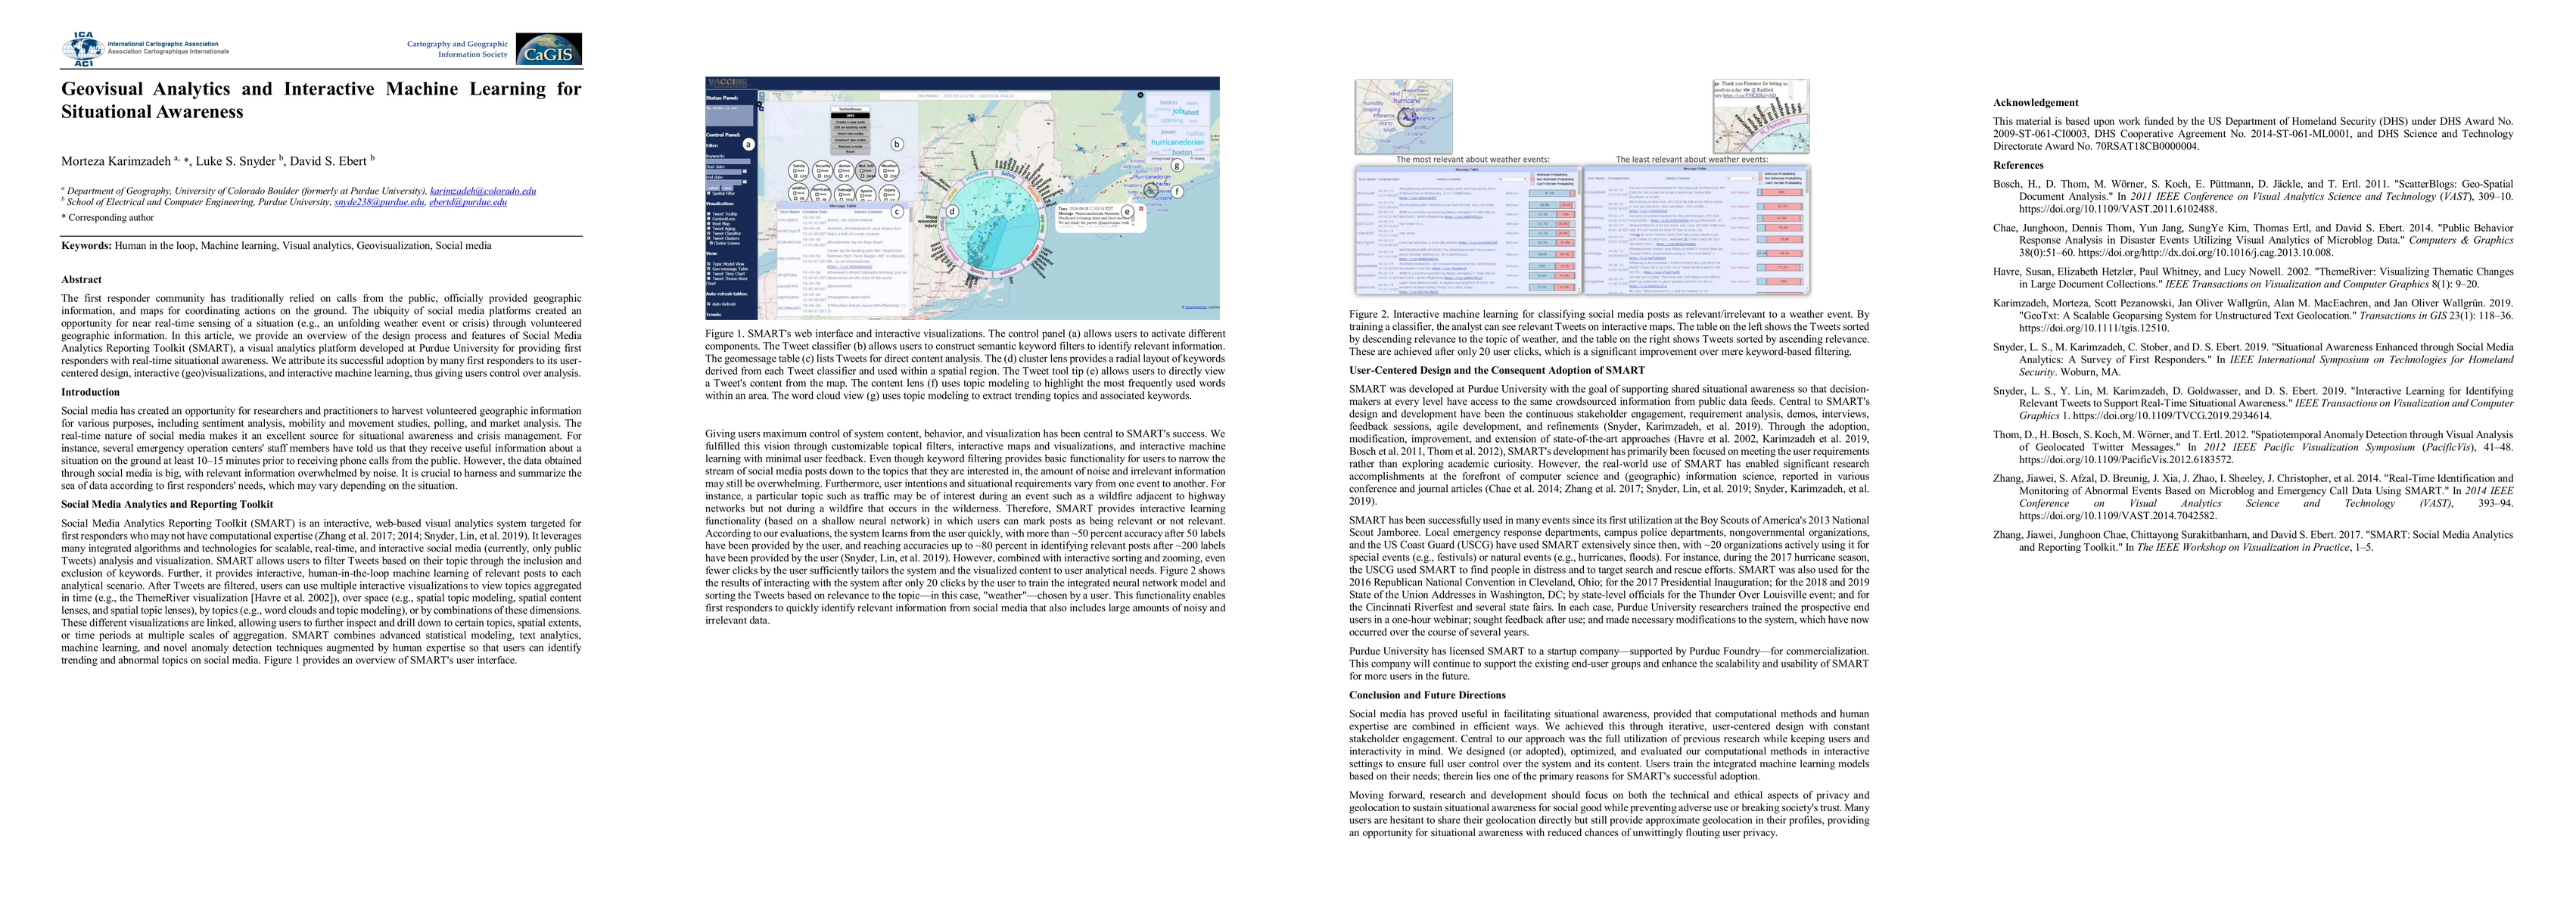
The first responder community has traditionally relied on calls from the public, officially-provided geographic information and maps for coordinating actions on the ground. The ubiquity of social media platforms created an opportunity for near real-time sensing of the situation (e.g. unfolding weather events or crises) through volunteered geographic information. In this article, we provide an overview of the design process and features of the Social Media Analytics Reporting Toolkit (SMART), a visual analytics platform developed at Purdue University for providing first responders with real-time situational awareness. We attribute its successful adoption by many first responders to its user-centered design, interactive (geo)visualizations and interactive machine learning, giving users control over analysis.
AI Key Findings
Get AI-generated insights about this paper's methodology, results, significance, and more — seven facets brought into focus.
Impact
Paper Details
Authors
PDF Preview
Key Terms
Citation Network
Current paper (gray), citations (green), references (blue)
Display is limited for performance on very large graphs.
Discussion 0