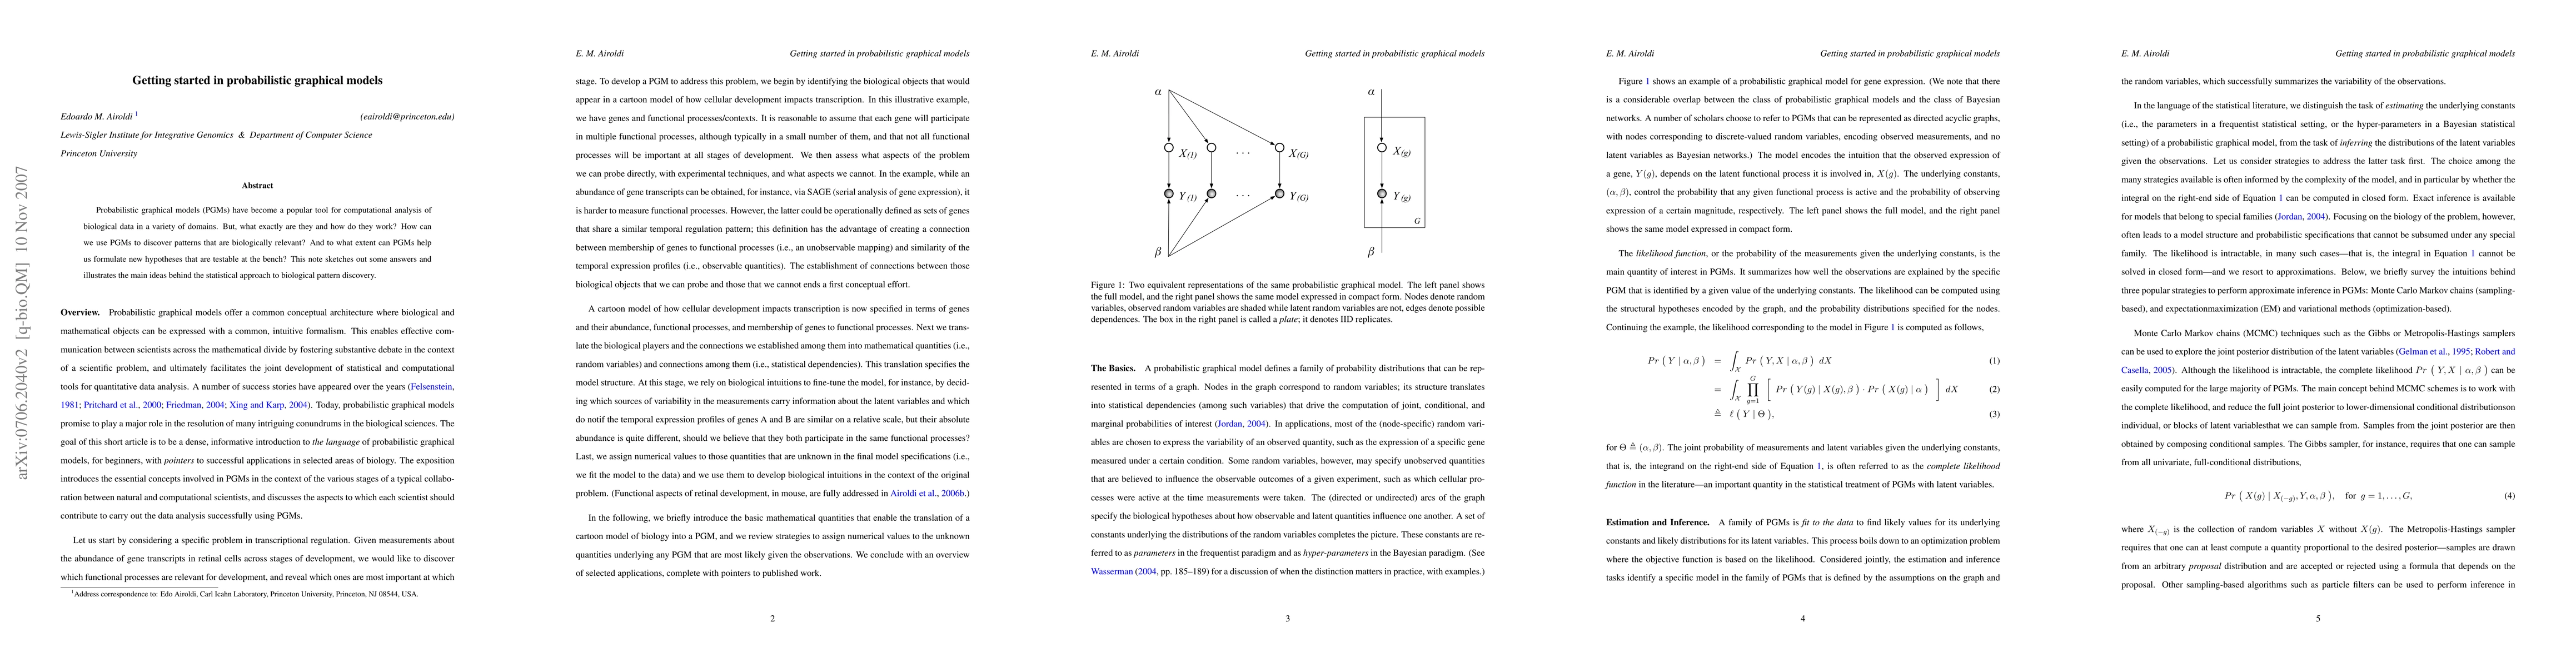
Getting started in probabilistic graphical models
Publication
Metrics
AI Quick Summary
This paper introduces probabilistic graphical models for discovering patterns in biological data and formulating testable hypotheses. It sketches a statistical approach to biological pattern discovery, highlighting the potential of PGMs for biologically relevant insights.
Paper Preview
Abstract
Probabilistic graphical models (PGMs) have become a popular tool for computational analysis of biological data in a variety of domains. But, what exactly are they and how do they work? How can we use PGMs to discover patterns that are biologically relevant? And to what extent can PGMs help us formulate new hypotheses that are testable at the bench? This note sketches out some answers and illustrates the main ideas behind the statistical approach to biological pattern discovery.
AI Key Findings
Get AI-generated insights about this paper's methodology, results, significance, and more — seven facets brought into focus.
Impact
Paper Details
PDF Preview
Key Terms
Citation Network
Current paper (gray), citations (green), references (blue)
Display is limited for performance on very large graphs.
Discussion 0