Quick Summary:

GistVis is an automatic pipeline that generates word-scale visualizations from data-rich documents, enhancing comprehension through visual insights. The system comprises Discoverer, Annotator, Extractor, and Visualizer modules, showing effectiveness in improving user understanding and reducing cognitive load.

Summary

Data-rich documents are ubiquitous in various applications, yet they often rely solely on textual descriptions to convey data insights. Prior research primarily focused on providing visualization-centric augmentation to data-rich documents. However, few have explored using automatically generated word-scale visualizations to enhance the document-centric reading process. As an exploratory step, we propose GistVis, an automatic pipeline that extracts and visualizes data insight from text descriptions. GistVis decomposes the generation process into four modules: Discoverer, Annotator, Extractor, and Visualizer, with the first three modules utilizing the capabilities of large language models and the fourth using visualization design knowledge. Technical evaluation including a comparative study on Discoverer and an ablation study on Annotator reveals decent performance of GistVis. Meanwhile, the user study (N=12) showed that GistVis could generate satisfactory word-scale visualizations, indicating its effectiveness in facilitating users' understanding of data-rich documents (+5.6% accuracy) while significantly reducing their mental demand (p=0.016) and perceived effort (p=0.033).
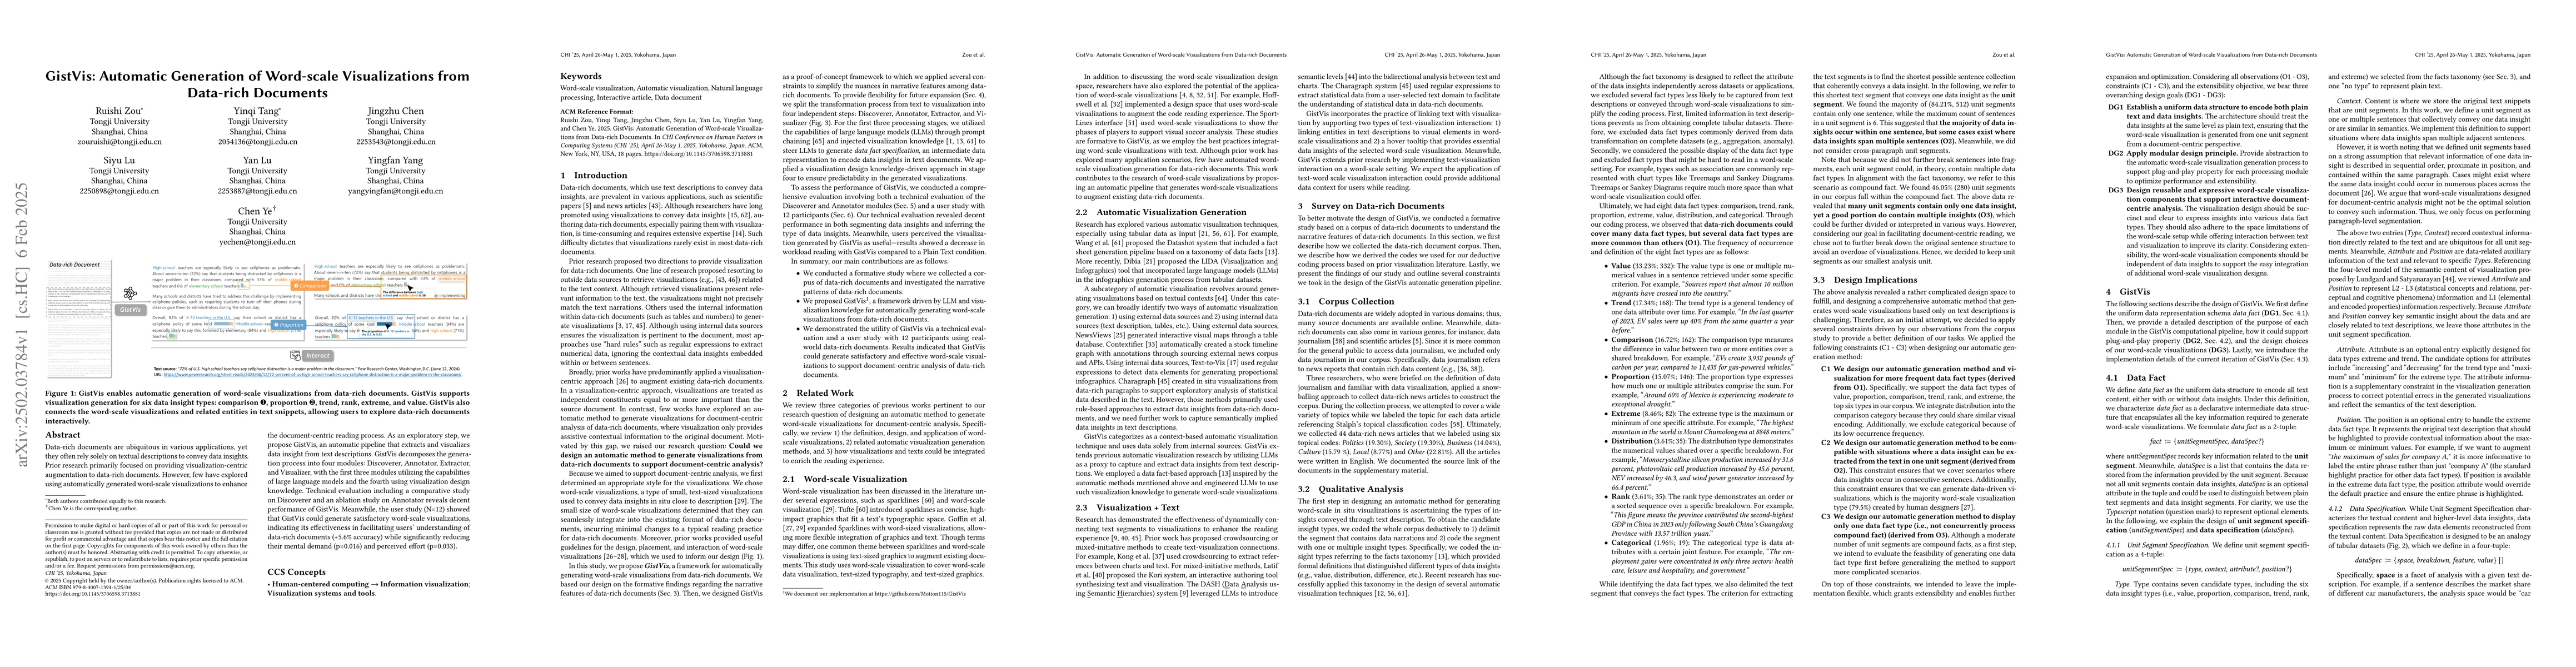
AI Key Findings

Generated Jun 11, 2025

Methodology

The research proposes GistVis, an automatic pipeline that extracts and visualizes data insights from text descriptions in data-rich documents. It consists of four modules: Discoverer, Annotator, Extractor, and Visualizer, utilizing large language models and visualization design knowledge.

Key Results

  • GistVis showed decent performance in technical evaluation, including a comparative study on Discoverer and an ablation study on Annotator.
  • User study (N=12) indicated that GistVis could generate satisfactory word-scale visualizations, enhancing users' understanding of data-rich documents (+5.6% accuracy) and significantly reducing mental demand (p=0.016) and perceived effort (p=0.033).
  • Discoverer module performed best with 68.6% accurate segmentation, compared to regex (54.5%), BERT (61.1%), and SentenceBERT (60.0%).
  • Annotator module achieved an overall accuracy of 0.79, precision of 0.92, recall of 0.79, and F1-score of 0.84.
  • Participants spent similar amounts of time answering questions under both GistVis and Plain Text conditions (p=0.536).

Significance

This research is significant as it explores the use of large language models to automatically generate word-scale visualizations from data-rich documents, potentially enhancing the reading experience and understanding of such documents.

Technical Contribution

GistVis, an automatic pipeline that extracts and visualizes data insights from text descriptions in data-rich documents using large language models and visualization design knowledge.

Novelty

This work is novel in its exploration of automatically generating word-scale visualizations from data-rich documents to enhance the document-centric reading process, using large language models and visualization design principles.

Limitations

  • The study did not include original visualizations from data-rich documents to avoid bias, focusing instead on plain text versions.
  • The evaluation was limited to six well-structured data documents from Pew Research, which may not cover the full range of data-rich document types.

Future Work

  • Investigate finer-grained information about which parts of word-scale visualizations are most effective using eye-tracking technology.
  • Lift constraints of GistVis to encompass a wider range of conditions, including data insights spanning multiple paragraphs or the entire passage.
  • Collect and analyze a more comprehensive dataset of data-rich documents for better algorithm design and evaluation.
  • Expand the design space of word-scale visualizations by implementing better in-context learning strategies and generating large-scale datasets for visualization research.

Paper Details

PDF Preview

Download PDF

Key Terms

No key terms available for this paper.

Citation Network

Current paper (gray), citations (green), references (blue)

Current Paper
Citations
References
Click to view

No citations found for this paper.

Comments (0)

This website uses cookies to ensure you get the best experience. Learn more