GiViP: A Visual Profiler for Distributed Graph Processing Systems
Publication
Metrics
AI Quick Summary
GiViP is a visual profiler designed to simplify the profiling and debugging of distributed graph processing systems. It captures and analyzes the extensive message traffic during computations, offering an interactive interface to detect anomalies in both computation and infrastructure.
Paper Preview
Abstract
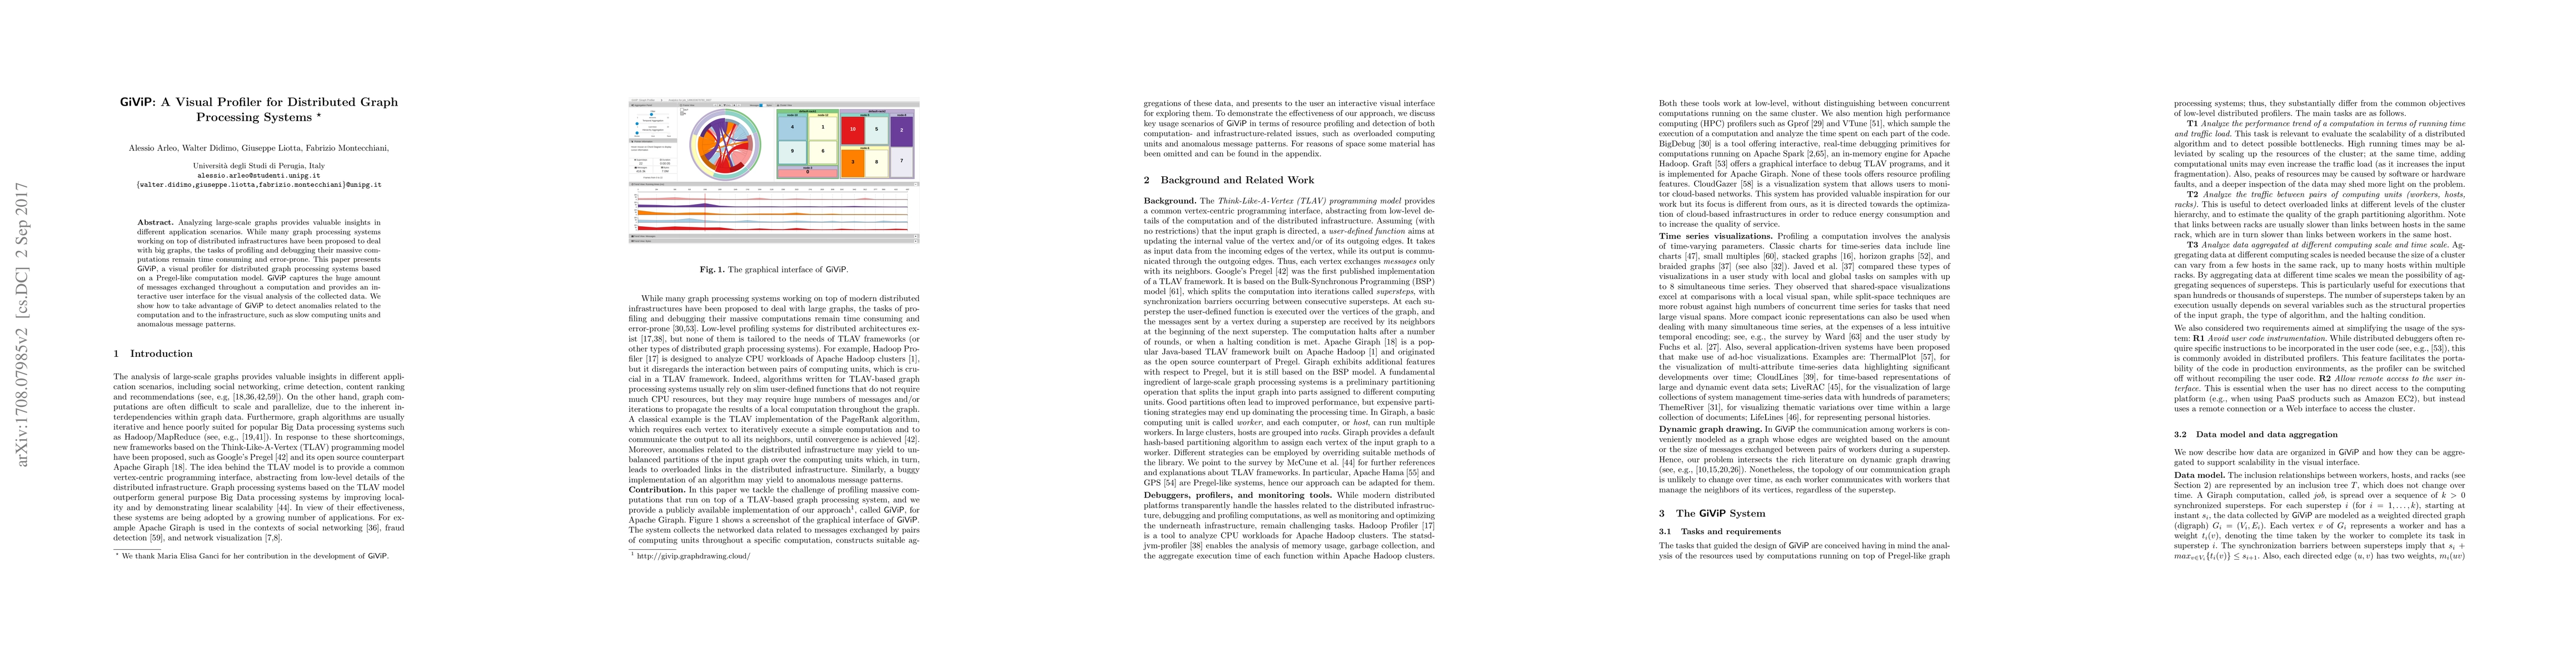
Analyzing large-scale graphs provides valuable insights in different application scenarios. While many graph processing systems working on top of distributed infrastructures have been proposed to deal with big graphs, the tasks of profiling and debugging their massive computations remain time consuming and error-prone. This paper presents GiViP, a visual profiler for distributed graph processing systems based on a Pregel-like computation model. GiViP captures the huge amount of messages exchanged throughout a computation and provides an interactive user interface for the visual analysis of the collected data. We show how to take advantage of GiViP to detect anomalies related to the computation and to the infrastructure, such as slow computing units and anomalous message patterns.
AI Key Findings
Get AI-generated insights about this paper's methodology, results, significance, and more — seven facets brought into focus.
Impact
Paper Details
PDF Preview
Key Terms
Citation Network
Current paper (gray), citations (green), references (blue)
Display is limited for performance on very large graphs.
Discussion 0