Glassy clusters: Relations between their dynamics and characteristic features of their energy landscape
Publication
Metrics
AI Quick Summary
This paper introduces distance-energy (DE) plots to characterize the potential energy surface of clusters, showing that they effectively distinguish between glassy and non-glassy systems based on their dynamics. The analysis reveals that only non-glassy clusters can be synthesized experimentally, despite both types being found in simulations.
Paper Preview
Abstract
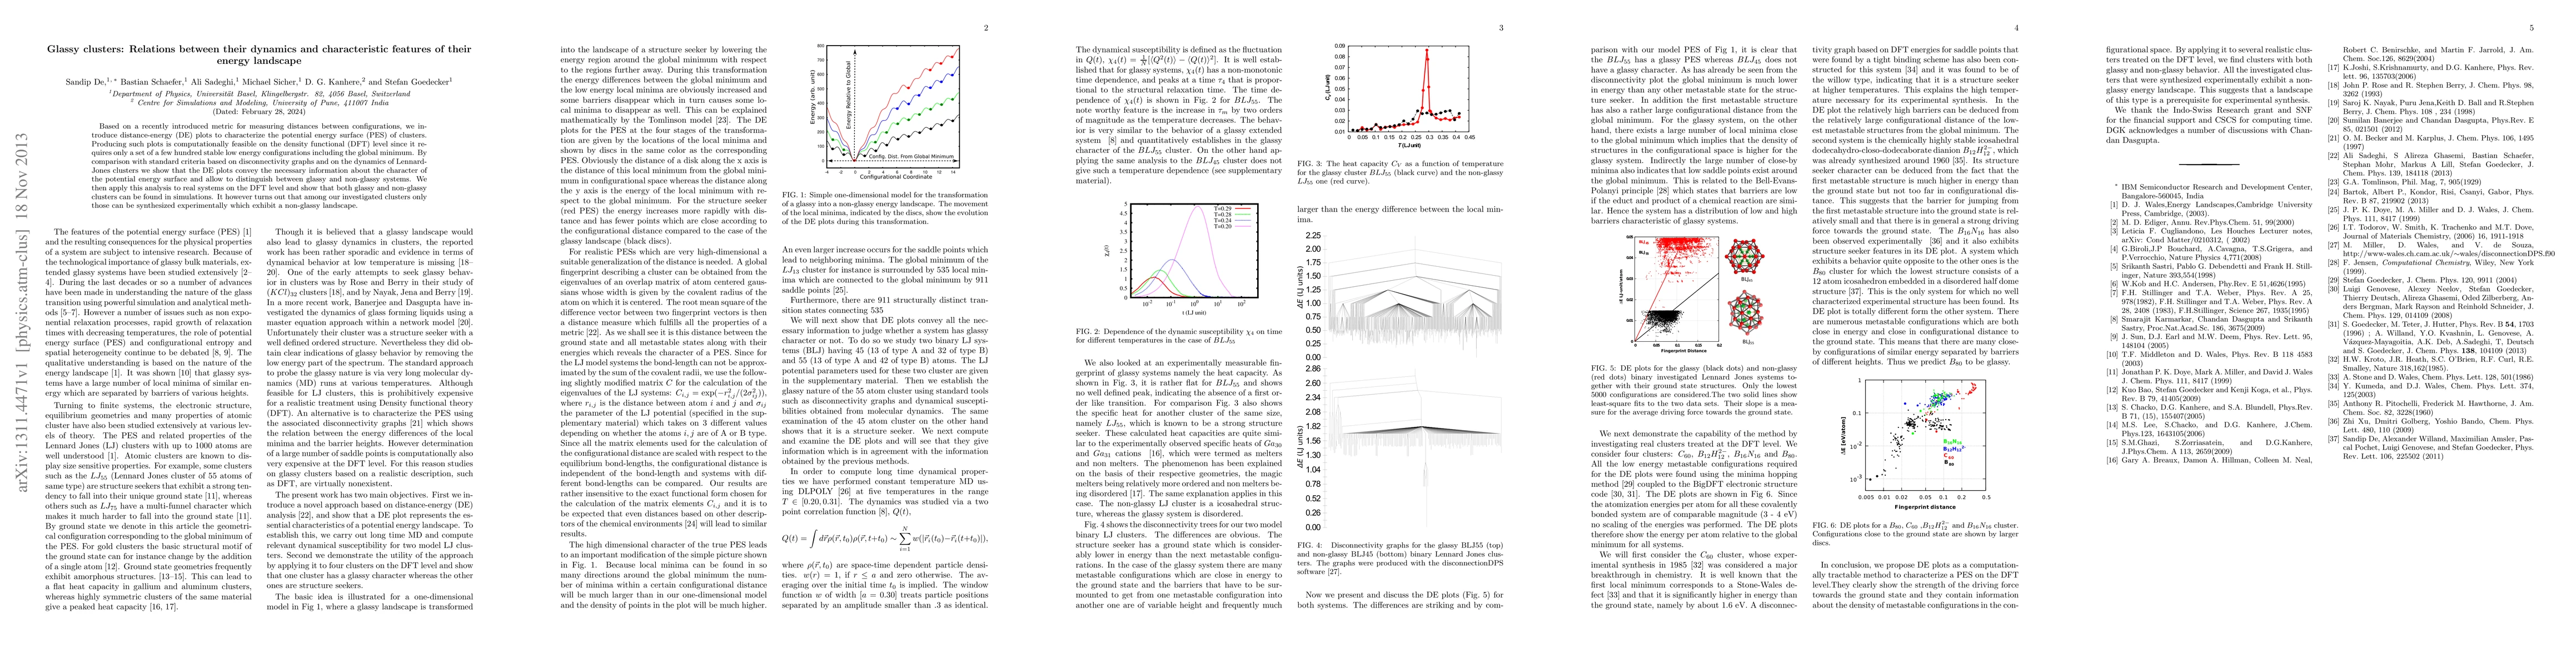
Based on a recently introduced metric for measuring distances between configurations, we in- troduce distance-energy (DE) plots to characterize the potential energy surface (PES) of clusters. Producing such plots is computationally feasible on the density functional (DFT) level since it re- quires only a set of a few hundred stable low energy configurations including the global minimum. By comparison with standard criteria based on disconnectivity graphs and on the dynamics of Lennard- Jones clusters we show that the DE plots convey the necessary information about the character of the potential energy surface and allow to distinguish between glassy and non-glassy systems. We then apply this analysis to real systems on the DFT level and show that both glassy and non-glassy clusters can be found in simulations. It however turns out that among our investigated clusters only those can be synthesized experimentally which exhibit a non-glassy landscape.
AI Key Findings
Get AI-generated insights about this paper's methodology, results, significance, and more — seven facets brought into focus.
Impact
Paper Details
PDF Preview
Key Terms
Citation Network
Current paper (gray), citations (green), references (blue)
Display is limited for performance on very large graphs.
Discussion 0