Summary
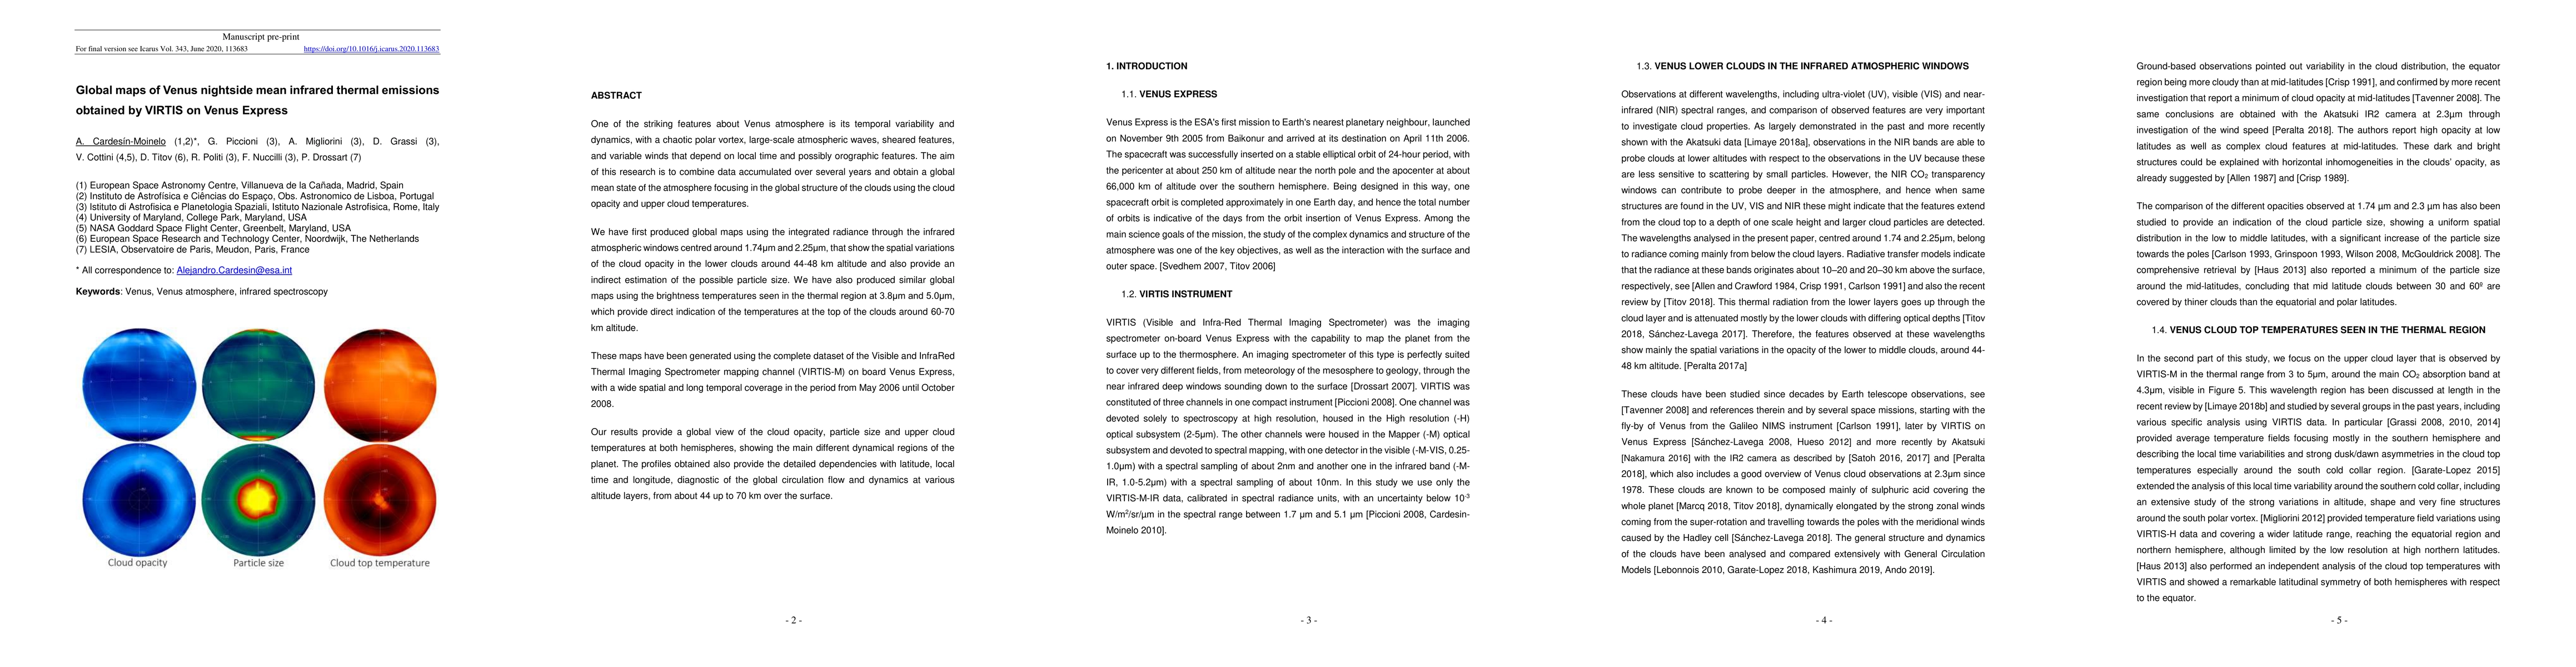
One of the striking features about Venus atmosphere is its temporal variability and dynamics, with a chaotic polar vortex, large-scale atmospheric waves, sheared features, and variable winds that depend on local time and possibly orographic features. The aim of this research is to combine data accumulated over several years and obtain a global mean state of the atmosphere focusing in the global structure of the clouds using the cloud opacity and upper cloud temperatures. We have first produced global maps using the integrated radiance through the infrared atmospheric windows centred around 1.74{\mu}m and 2.25{\mu}m, that show the spatial variations of the cloud opacity in the lower clouds around 44-48 km altitude and also provide an indirect estimation of the possible particle size. We have also produced similar global maps using the brightness temperatures seen in the thermal region at 3.8{\mu}m and 5.0{\mu}m, which provide direct indication of the temperatures at the top of the clouds around 60-70 km altitude. These maps have been generated using the complete dataset of the Visible and InfraRed Thermal Imaging Spectrometer mapping channel (VIRTIS-M) on board Venus Express, with a wide spatial and long temporal coverage in the period from May 2006 until October 2008. Our results provide a global view of the cloud opacity, particle size and upper cloud temperatures at both hemispheres, showing the main different dynamical regions of the planet. The profiles obtained also provide the detailed dependencies with latitude, local time and longitude, diagnostic of the global circulation flow and dynamics at various altitude layers, from about 44 up to 70 km over the surface.
AI Key Findings
Generated Sep 03, 2025
Methodology
The research utilized data from the VIRTIS instrument onboard Venus Express, mapping the nightside infrared thermal emissions over several years (2006-2008) to derive global mean states of Venus' atmosphere, focusing on cloud opacity and temperatures.
Key Results
- Global maps of integrated radiance through infrared atmospheric windows (1.74μm and 2.25μm) reveal spatial variations in lower cloud opacity and provide indirect particle size estimation.
- Similar global maps using brightness temperatures at 3.8μm and 5.0μm offer direct temperature measurements at the upper cloud levels (60-70 km altitude).
- Detailed profiles show dependencies with latitude, local time, and longitude, indicating global circulation flow and dynamics at various altitude layers (44-70 km).
- Distinct dynamical regions are identified, including an equatorial belt, mid-latitude regions, cold collars, and polar regions, each with unique characteristics in cloud opacity, particle size, and temperature.
Significance
This study provides a comprehensive view of Venus' nightside atmospheric structure, crucial for understanding the planet's dynamics, cloud processes, and atmospheric circulation patterns, which can inform future missions and models.
Technical Contribution
The paper presents advanced data processing techniques and global mapping methods to derive meaningful atmospheric parameters from extensive VIRTIS-M observations, setting a benchmark for future similar studies.
Novelty
This research offers a detailed, long-term analysis of Venus' nightside atmospheric emissions, revealing distinct dynamical regions and providing comprehensive profiles of cloud opacity, particle size, and temperature, which were not previously available at this scale and resolution.
Limitations
- Limited coverage in the northern hemisphere due to orbital constraints affects the completeness of the global analysis.
- The study does not investigate the surface-cloud interactions, leaving room for further exploration.
Future Work
- Expanding observations in the northern hemisphere to improve global coverage and analysis.
- Investigating surface-cloud interactions to provide a more holistic understanding of Venus' atmospheric processes.
Paper Details
PDF Preview
Key Terms
Citation Network
Current paper (gray), citations (green), references (blue)
Display is limited for performance on very large graphs.
Similar Papers
Found 4 papersSix years of Venus winds at the upper cloud level from UV, visible and near infrared observations from VIRTIS on Venus Express
Ricardo Hueso, Itziar Garate-Lopez, Javier Peralta et al.
Validation of the IPSL Venus GCM Thermal Structure with Venus Express Data
Giuseppe Piccioni, Alessandra Migliorini, Pietro Scarica et al.
A WISPR of the Venus Surface: Analysis of the Venus Nightside Thermal Emission at Optical Wavelengths
A. Vourlidas, L. C. Mayorga, N. E. Raouafi et al.
| Title | Authors | Year | Actions |
|---|
Comments (0)