Publication
Metrics
Paper Preview
Abstract
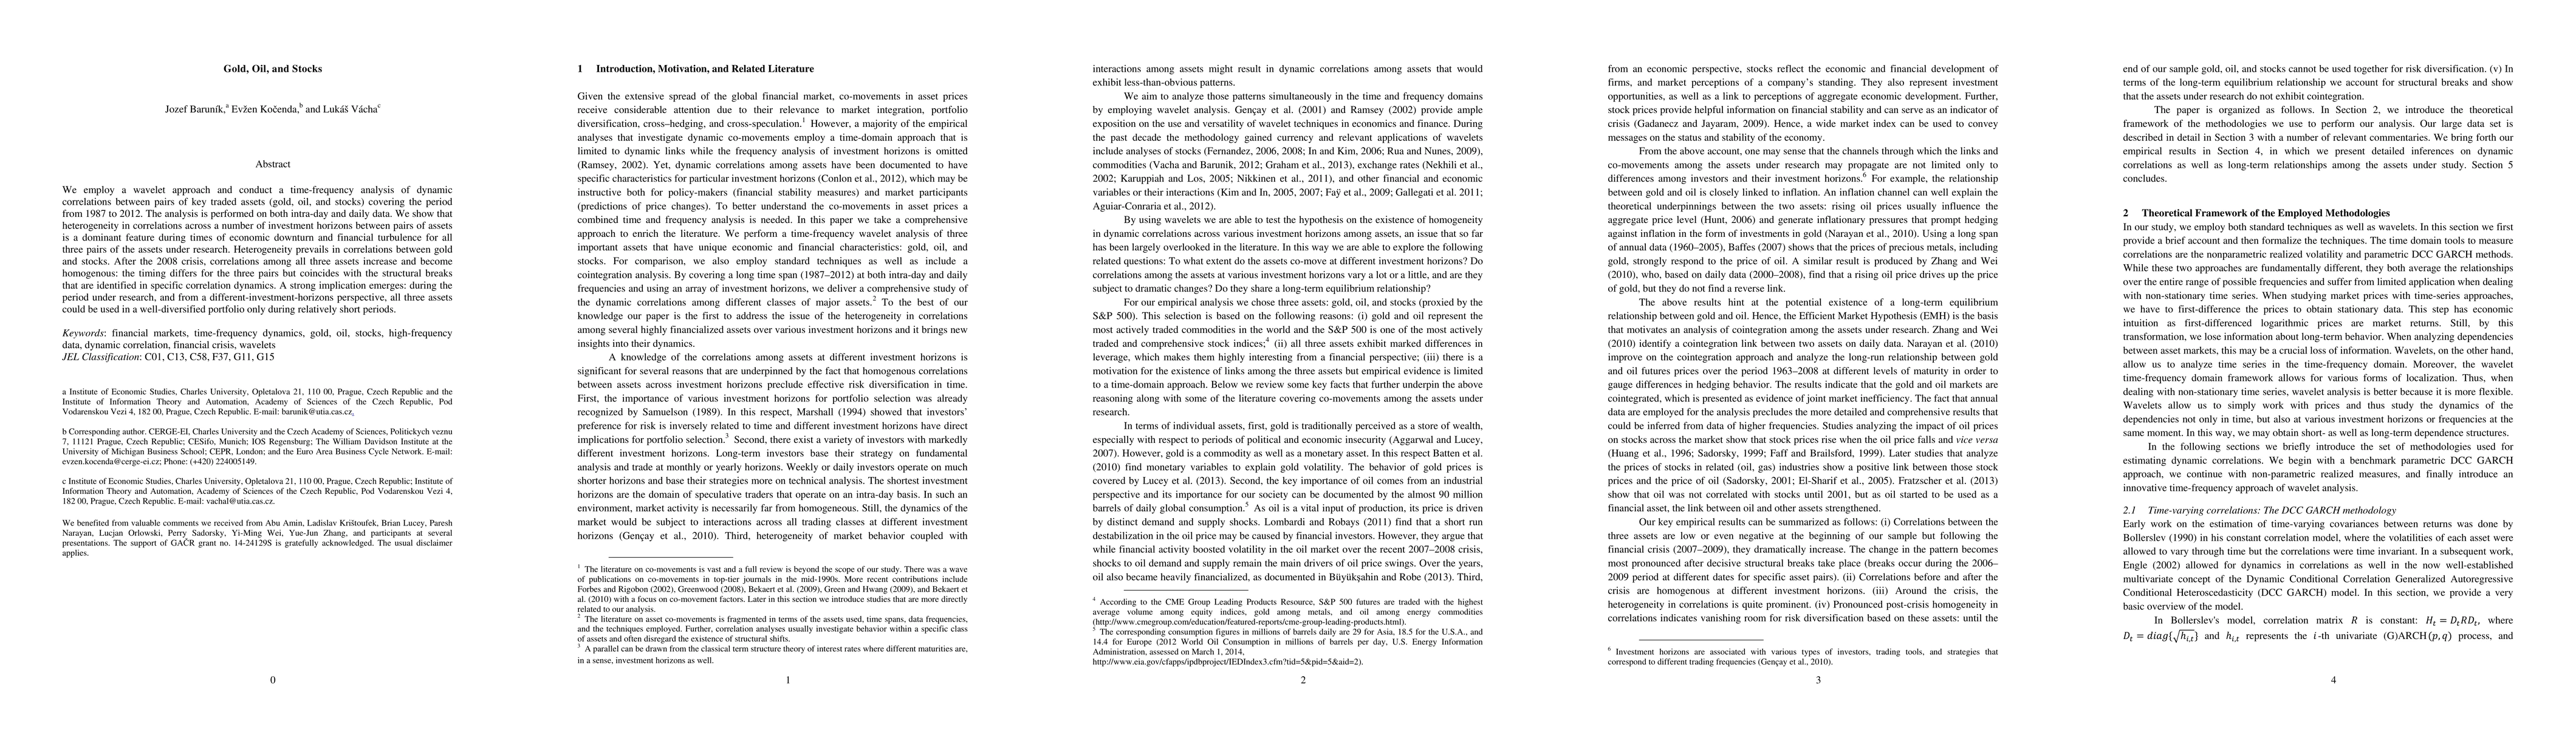
We employ a wavelet approach and conduct a time-frequency analysis of dynamic correlations between pairs of key traded assets (gold, oil, and stocks) covering the period from 1987 to 2012. The analysis is performed on both intra-day and daily data. We show that heterogeneity in correlations across a number of investment horizons between pairs of assets is a dominant feature during times of economic downturn and financial turbulence for all three pairs of the assets under research. Heterogeneity prevails in correlations between gold and stocks. After the 2008 crisis, correlations among all three assets increase and become homogenous: the timing differs for the three pairs but coincides with the structural breaks that are identified in specific correlation dynamics. A strong implication emerges: during the period under research, and from a different-investment-horizons perspective, all three assets could be used in a well-diversified portfolio only during relatively short periods.
AI Key Findings
Get AI-generated insights about this paper's methodology, results, significance, and more — seven facets brought into focus.
Impact
Paper Details
PDF Preview
Key Terms
Citation Network
Current paper (gray), citations (green), references (blue)
Display is limited for performance on very large graphs.
Discussion 0