Graph-based Time Series Clustering for End-to-End Hierarchical Forecasting
Publication
Metrics
AI Quick Summary
This paper proposes a graph-based methodology to integrate relational and hierarchical inductive biases for deep learning in time series forecasting, leveraging pyramidal graph structures and trainable graph pooling for learning hierarchical structures directly from data. The method includes a differentiable reconciliation stage, enhancing both architectural bias and regularization, and outperforms state-of-the-art approaches in simulations.
Paper Preview
Abstract
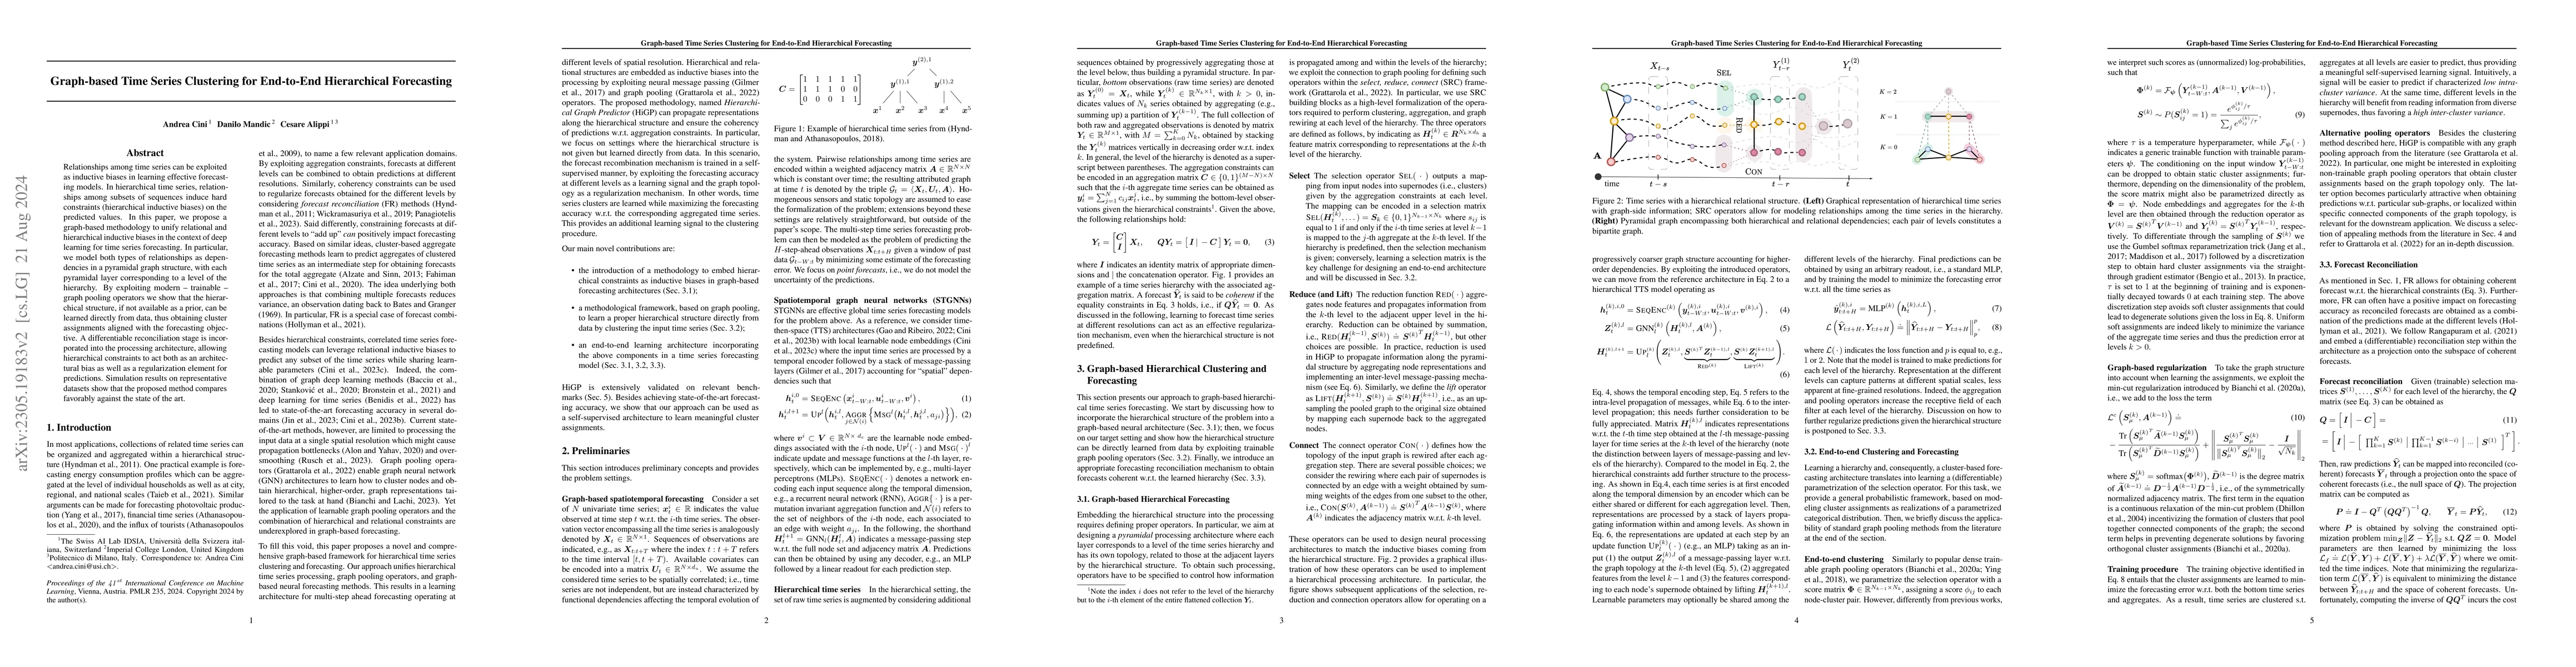
Existing relationships among time series can be exploited as inductive biases in learning effective forecasting models. In hierarchical time series, relationships among subsets of sequences induce hard constraints (hierarchical inductive biases) on the predicted values. In this paper, we propose a graph-based methodology to unify relational and hierarchical inductive biases in the context of deep learning for time series forecasting. In particular, we model both types of relationships as dependencies in a pyramidal graph structure, with each pyramidal layer corresponding to a level of the hierarchy. By exploiting modern - trainable - graph pooling operators we show that the hierarchical structure, if not available as a prior, can be learned directly from data, thus obtaining cluster assignments aligned with the forecasting objective. A differentiable reconciliation stage is incorporated into the processing architecture, allowing hierarchical constraints to act both as an architectural bias as well as a regularization element for predictions. Simulation results on representative datasets show that the proposed method compares favorably against the state of the art.
AI Key Findings
Get AI-generated insights about this paper's methodology, results, significance, and more — seven facets brought into focus.
Impact
Paper Details
Authors
PDF Preview
Key Terms
Citation Network
Current paper (gray), citations (green), references (blue)
Display is limited for performance on very large graphs.
Discussion 0