Graph spectra as a systematic tool in computational biology
Publication
Metrics
AI Quick Summary
Researchers used graph spectra to analyze biological networks, identifying patterns that suggest hypotheses about their evolution. They found characteristic traces in the spectrum of processes like motif joining or duplication.
Paper Preview
Abstract
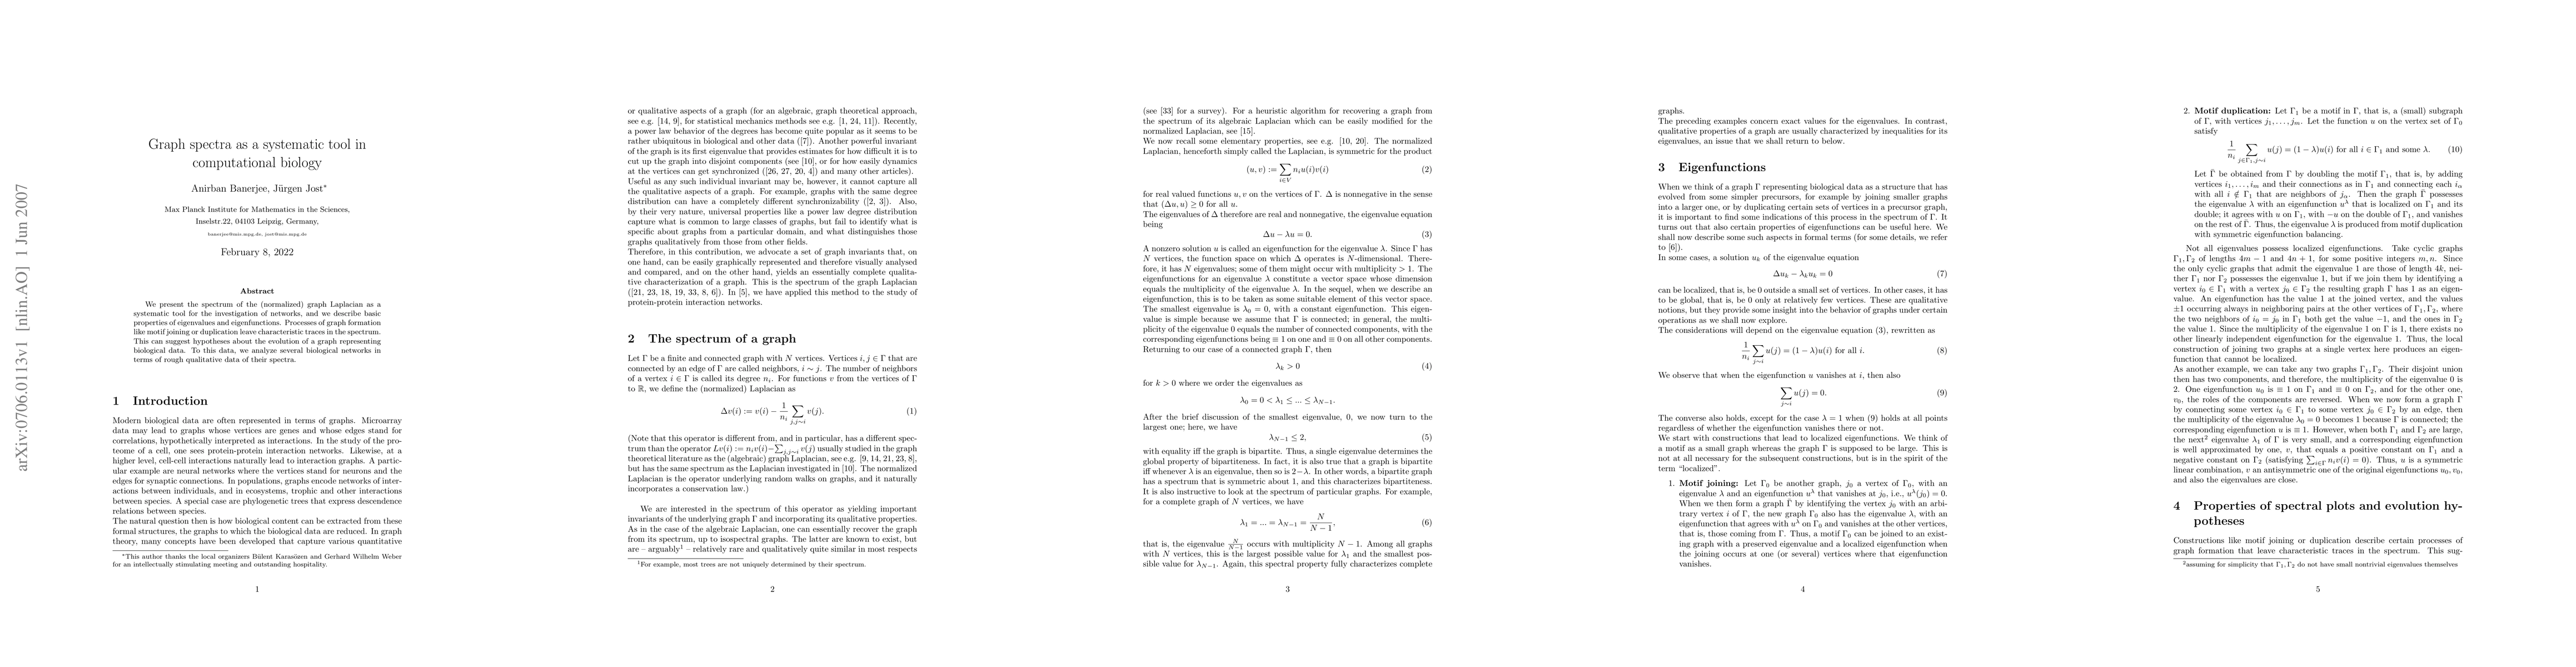
We present the spectrum of the (normalized) graph Laplacian as a systematic tool for the investigation of networks, and we describe basic properties of eigenvalues and eigenfunctions. Processes of graph formation like motif joining or duplication leave characteristic traces in the spectrum. This can suggest hypotheses about the evolution of a graph representing biological data. To this data, we analyze several biological networks in terms of rough qualitative data of their spectra.
AI Key Findings
Get AI-generated insights about this paper's methodology, results, significance, and more — seven facets brought into focus.
Impact
Paper Details
PDF Preview
Key Terms
Citation Network
Current paper (gray), citations (green), references (blue)
Display is limited for performance on very large graphs.
Discussion 0